Strategies
Dayparting Framework for Amazon PPC to Boost Ad Visibility
Jan 11, 2024

Snapshot
Introduction
What are the best ways of analysing Amazon SP hourly report data?
7 things your Ad automation software should have to set up a good dayparting strategy
Conclusion
FAQs
Amazon recently introduced the Hourly Sponsored Product Report in its reporting portal, providing a detailed, hour-by-hour breakdown of how your Sponsored Products are performing. This report offers valuable insights into your customers’ shopping behavior, helping you identify the best hours for conversions and the worst hours for ACOS.
With this data, you can strategically implement dayparting for Amazon PPC that allows you to schedule your ads during high-conversion periods while minimizing wasted ad spend during low-performing hours.
By now, you already know what dayparting is. Dayparting is an Amazon PPC strategy that enables you to adjust budgets or bids through the day/week as per performance trends. When customers’ buying tendency is high (e.g., it could be Mondays and Wednesdays), you can go aggressive on bids and budgets. When customers’ buying tendency is low, you can go less aggressive on bids and budgets. You can read all about dayparting basics in this blog post here.
With the Hourly Sponsored Product Report, mastering dayparting becomes more precise, enabling you to make smarter, data-driven decisions for improved campaign performance.
If you do not want to read this detailed post, you can watch our dayparting tutorial here:
What are the best ways of analysing Amazon SP hourly report data?
There are 2 ways of analyzing the Amazon SP hourly report.
Option 1: Analyze SP hourly report manually:
Manually analysing the SP Hourly Report allows you to dive deep into the data, identify key trends such as peak hours for conversions, and adjust your campaign strategy accordingly. This is a time-consuming process which gives you granular control over ad performance, helping you implement dayparting for Amazon PPC to reduce ACOS and maximize ad visibility during high conversion periods.
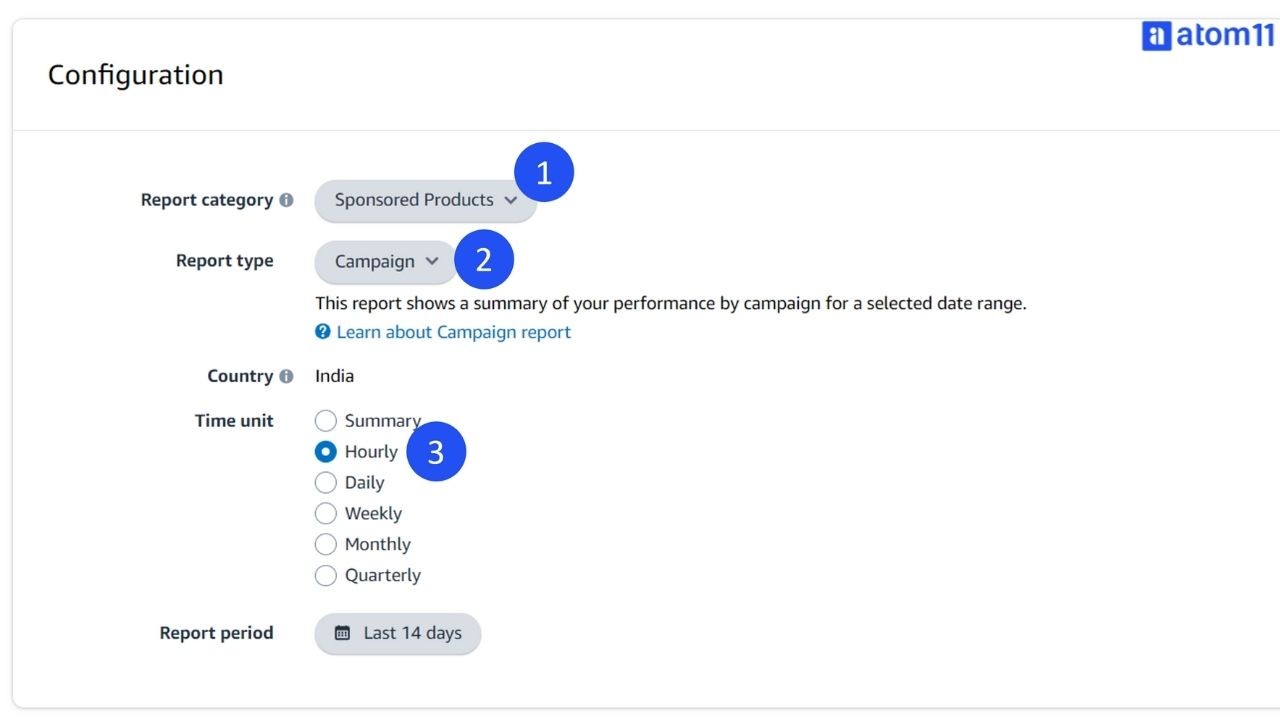
Go to Reports > Sponsored Products > Campaigns > Hourly. Download last 14 days data from here.
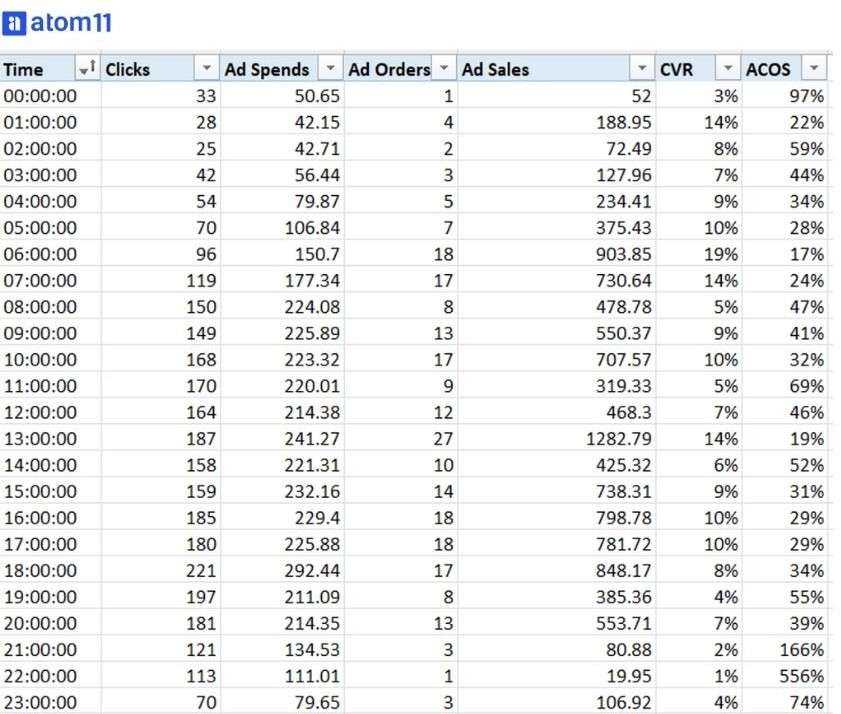
Create Pivot on Time and analyze Spends, Conversion and CPC
Use the data to create a pivot. Use the following settings:
Rows: Start Time
Values: Metrics in the following order: Clicks, Spend, Sale, Orders
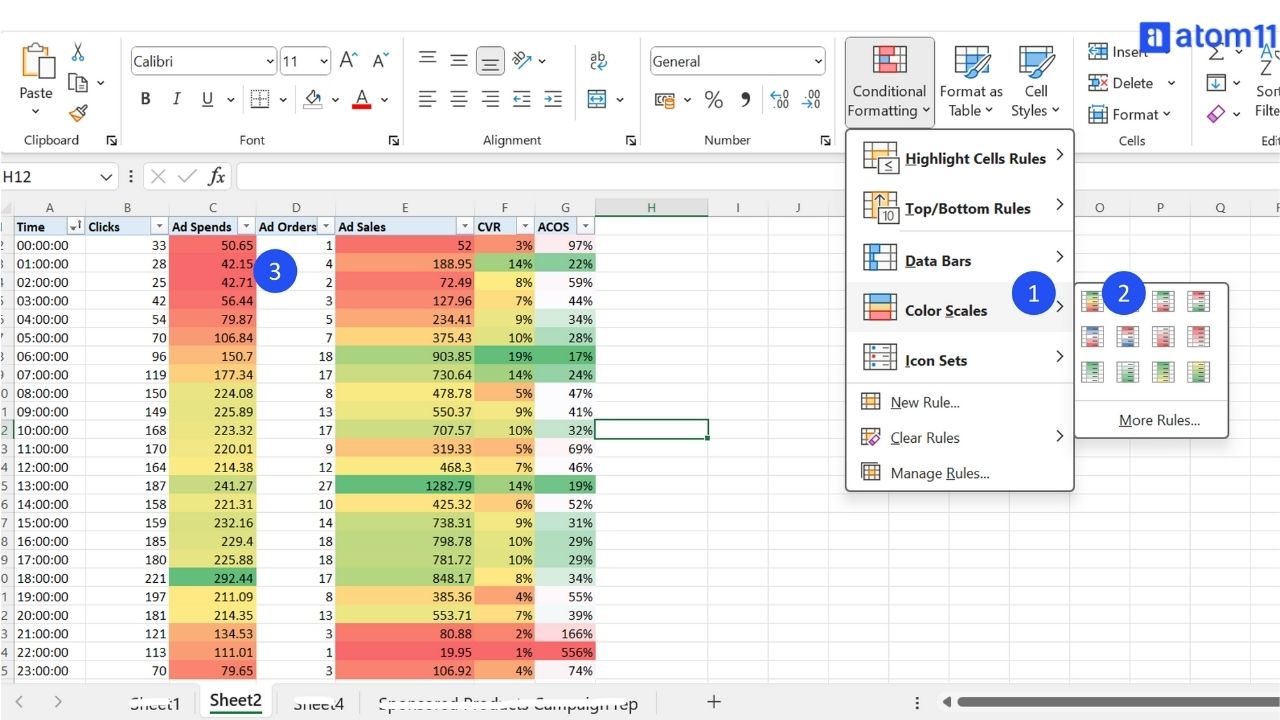
Go to Conditional Formatting and use “Color Scales” to highlight Spends, Conversion and CPC Low to High
Set up your conditional formatting in the following scales:
Sales - Highest color scale will be green, lowest will be red
CPC - Highest color scale will be red, lowest will be green
Conversion - Highest color scale will be green, lowest will be red
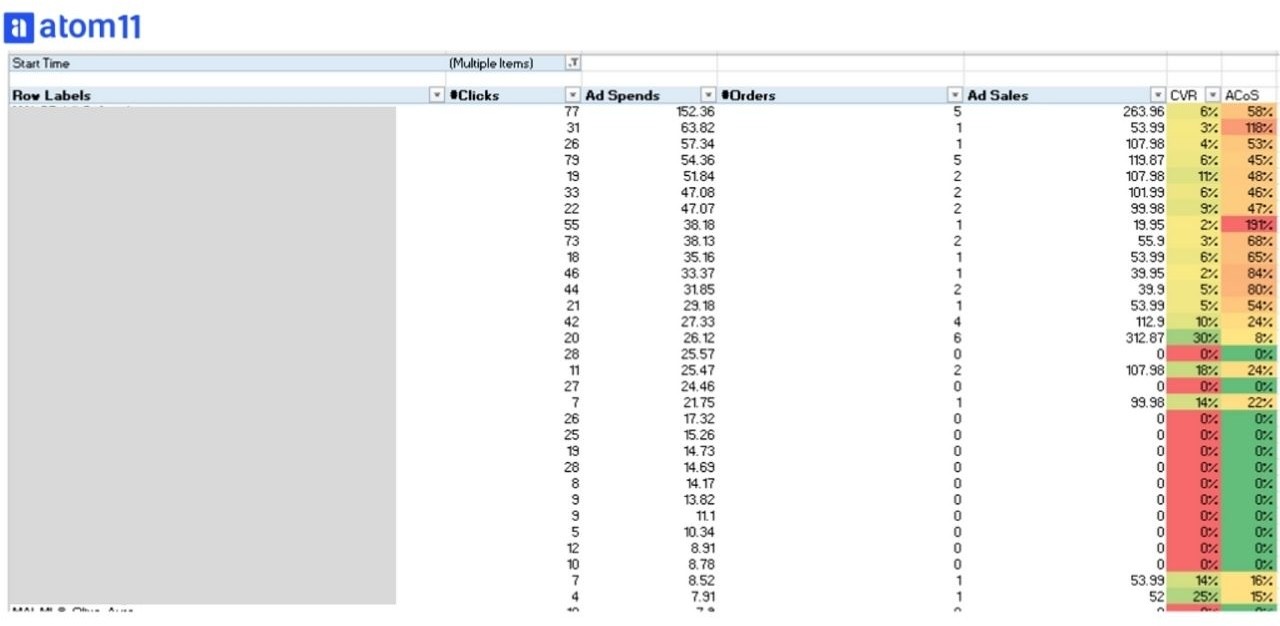
Bonus step 4: Once you have found out the low converting time periods for a brand, you can go to the level of granularity of the campaigns. All you have to do is, Filter the time period that you identified as low performing (ex. in above case - 19:00-23:00 hours). And for those hours, check the conversion rate of all campaigns. Only the campaigns that are not performing well - can be added to a dayparting strategy to reduce bids during the given hours.
The more granular you go into your data, the less are the chances of losing sales due to dayparting.
The ULTIMATE Dayparting framework:
With the above hourly data, you can use the following framework and set up a great dayparting strategy:
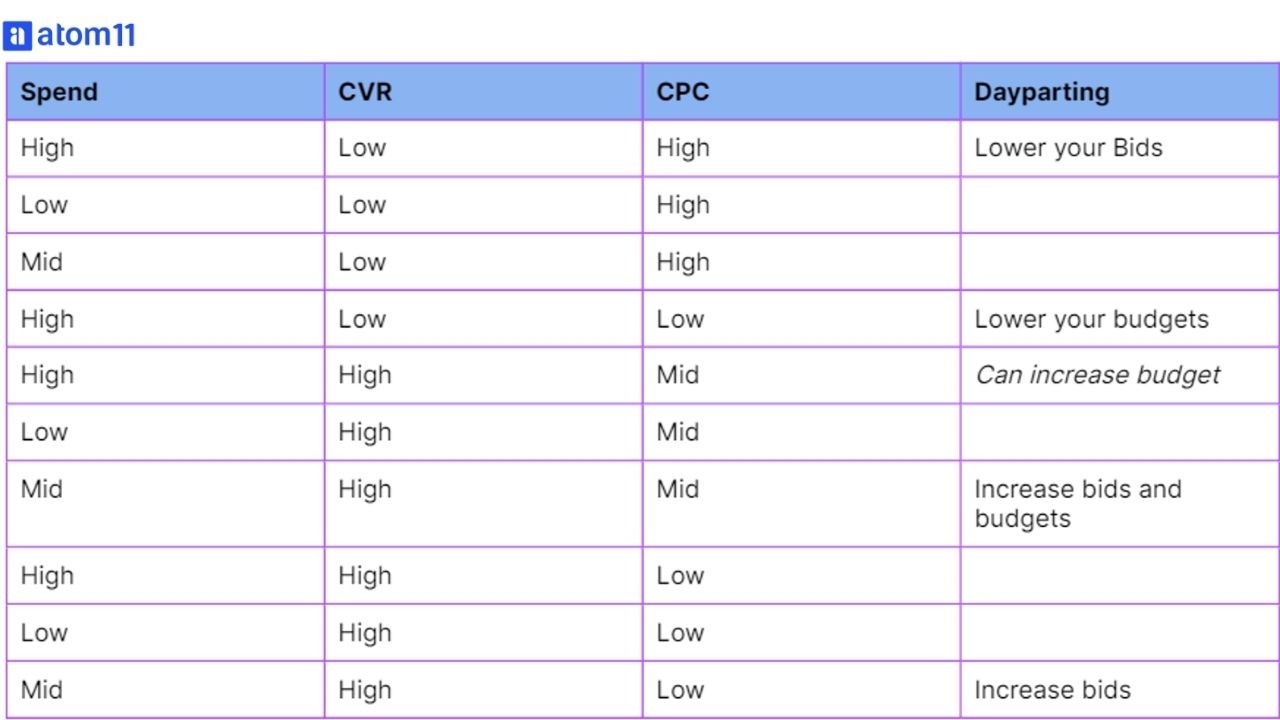
Let me explain how to use the above framework. In your dayparting report above, look for "continuous time periods" when your conversions are low, but spends are high. In the above case, this happens at 19:00 hours to 23:00 hours (I will give you a minute to go and check that)
This is the time period when you need to reduce your bids.
But, contrary to regular belief, this data shows great conversions at midnight, with very low spends. So I wouldnt suggest touching that data for any changes at this point of this.
It is important to understand that dayparting is not just up and down of bids. You can select between Bids or Budgets changes depending on the use case.
At anytime if you want to understand this framework better, you can book a meeting here.
Option 2: Analyze SP hourly report using Chat GPT:
Using ChatGPT to analyze the SP Hourly Report automates the data analysis process, which allows you to quickly identify key trends such as the best-performing hours and times when ACOS spikes. This AI-driven approach helps you efficiently implement dayparting for Amazon PPC, reducing wasted ad spend and maximizing visibility during the most profitable times of day.
You will need Chat GPT 4.0 (as of October’24). This is because you should be able to attach the hourly report on its dashboard so it can analyse the data basis of your prompt.
You can use the following steps to use Chat GPT for your analysis:
Step 1: Prepare yourself:
You need GPT4>Advanced data analytics to run this prompt. You will need to attach your hourly report for GPT4 to give responses.
Check if names of columns are correct. For ex. If you are a vendor, then 7 day total sales may not be the correct column name for you. It will be 14 days total sales.
Not everyone will tell you this, but make sure that when you are using the prompt for the first time, you have backend calculations to check chat gpt data. Once chat gpt gives you correct answers the first time, you can just repeat the process every month.
The prompt is divided into 4 parts - Part 1, 2, 3 and 4. They are all separated by a dotted line. Copy the prompt part by part. Ex. First copy Part 1, get the results from Chat GPT. Then copy Part 2 and continue in this fashion. Don’t worry, it will summarize everything for you towards the end.
Step 2: The prompt:
Part # 1: Analyze hour-level Amazon advertising performance data to identify low-conversion, high-CPC time slots.
Data Details:
Date format in "Start Date": MMM DD, YYYY. Start Time" is in the format "HH:MM" and contains datetime.time objects.
Time format in "Start Time": HH:MM. Treat it as string format and extract Hour data directly from there.
Given: 1st Jan 2023 was a Sunday
Details available in the excel file that I will upload:
“Impressions”
“Clicks”
Sales from column named: “7 Day Total Sales “. This data may have to be converted from string to numeric format
Spends from column named: “Spend”. This data may have to be converted from string to numeric format
"7 Day Total Sales " (note the space at the end) and "Spend" columns contain dollar amounts in string format, e.g., "$1,234.56". Convert these to numeric.
Orders from “7 Day Total Orders”
ROAS from column named: “Total Return on Advertising Spend (ROAS)”
Instructions:
From the "Start Date" column, extract the day of the week.
Aggregate data by hour
Calculate the conversion rate as:
Conversion Rate = Sum of (“7 Day Total Orders”) / Sum of (“Clicks”) * 100
Example: To calculate Conversion at 1700 hours, Sum of ( "7 Day Total Orders" at 1700 hours) = 50 and Sum of ("Clicks" at 1700 hours) = 250, then conversion rate at 1700 hours should be 20%.
If "7 Day Total Orders" = 0, set the conversion rate to 0%.
If “Clicks” = 0, ignore that value during aggregation
Calculate Cost per clicks (CPC) as:
Cost per click = Sum of (“Spend”) / Sum of (“Clicks”)
Example: To calculate CPC at 1800 hours, Sum of ( "Spends" at 1800 hours) = 50 and Sum of ("Clicks" at 1800 hours) = 12, then CPC at 1800 hours should be 4.16.
Identify time slots with conversion rates “strictly” lower than the dataset's average conversion rate and CPCs higher than the average CPC.
Group consecutive low-conversion, high-CPC hours into continuous time slots. For example, if 17:00, 18:00, and 19:00 all have low conversions, group them as 17:00-19:00.
Before sharing output do a verification of data points between aggregated and raw data.
Expected Output:
At this time, only group data by time, not day of the week
Group time slot by low conversion criteria, not longest time slot criteria
Please double check, that no time slot provided by you has a conversion rate higher than average conversion rate of the data
Provide at least three time slots with the lowest conversion rates and high CPC in the following format, sorted from lowest to highest conversion rate
If there is no slow where conversion is higher than average and CPC is higher than average, then specify that and say: “You might want to reduce budgets for these durations”
Slot 1: Start Time - End Time | Conversion Rate | CPC | Spend |ROAS
Slot 2: Start Time - End Time | Conversion Rate | CPC | Spend |ROAS
Slot 3: Start Time - End Time | Conversion Rate | CPC | Spend |ROAS
Also, mention any other noteworthy time slot with low conversions and high CPC.
Please save intermediate results and data as needed to avoid rework in case of disruptions
Ask for Part # 2 once I confirm above is correct.
—------------------------------------------------------------------------------------------------------------------
Note For YOU: Once Part #1 is complete, Chat GPT will ask you if they can proceed to Part #2. Confirm and share the next prompt. Note that you may need to upload data again.
—-------------------------------------------------------------------------------------------------------------------
Part 2: Tell me which days of the week have lowest conversion rate and lowest ROAS:
Aggregate the data by the day of the week.
Calculate the average conversion rate and average ROAS for each day of the week.
Identify the days with the lowest conversion rate and lowest ROAS
Also tell me 5 campaigns have lowest conversions throughout, that I should focus on first. Do not include campaigns that have 0 clicks.
Provide output in following format:
Reduce your budgets on following days as conversions are lowest: –
Please save intermediate results and data as needed to avoid rework in case of disruptions
Ask for Part # 3 once I confirm above is correct.
—-------------------------------------------------------------------------------------------------------------------
Part 3: Similar to Part 1 and Part 2, now focus on high conversion (higher than average conversion) time slots.
Please double check, that no time slot provided by you has a conversion rate lower than average conversion rate
Provide atleast three time slots with the highest conversion rates in the following format. All slots should be sorted from highest to lowest conversion rate
The output should look like:
Consider increasing bids at following slots as conversion is best at this time:
Slot 1: Start Time - End Time | Conversion Rate | CPC | Spend | ROAS
Slot 2: Start Time - End Time | Conversion Rate | CPC | Spend | ROAS
Slot 3: Start Time - End Time | Conversion Rate | CPC | Spend | ROAS
—------------------------------------------------------------------------------------------------------------------
Part 4: Tell me which days of the week have highest conversion rate and highest ROAS
Aggregate the data by the day of the week.
Calculate the average conversion rate and average ROAS for each day of the week.
Identify the days with the highest conversion rate and highest ROAS
Provide output in following format:
Increase your budgets on following days as conversions are best: –
Please save intermediate results and data as needed to avoid rework in case of disruptions
—------------------------------------------------------------------------------------------------------------------
Part 5: Summarize all parts in 1 response below
7 things your Ad automation software should have to set up a good dayparting strategy
Once you’ve analyzed the Sponsored Product Hourly Report data, the next step is to implement dayparting for Amazon PPC using either your ad automation software or the Amazon Ad console. We’ve written a detailed guide on how to set up dayparting using software, which you can find here.
If you’re using software to manage dayparting, there are seven essential features you should look for to ensure the most effective dayparting strategy. These features will help you optimize bids and budgets, reduce ACoS, and maximize visibility during high-conversion periods:
It should be available for all campaign types - SP, SB and SD
Available for both levers - bids, budgets. Top of search dayparting is good to have
Easy to set up
Data visualization at hourly and daily level
Scheduling options - so that you can schedule for a later date
Ability to set up dayparting for different days of the week and time of the day
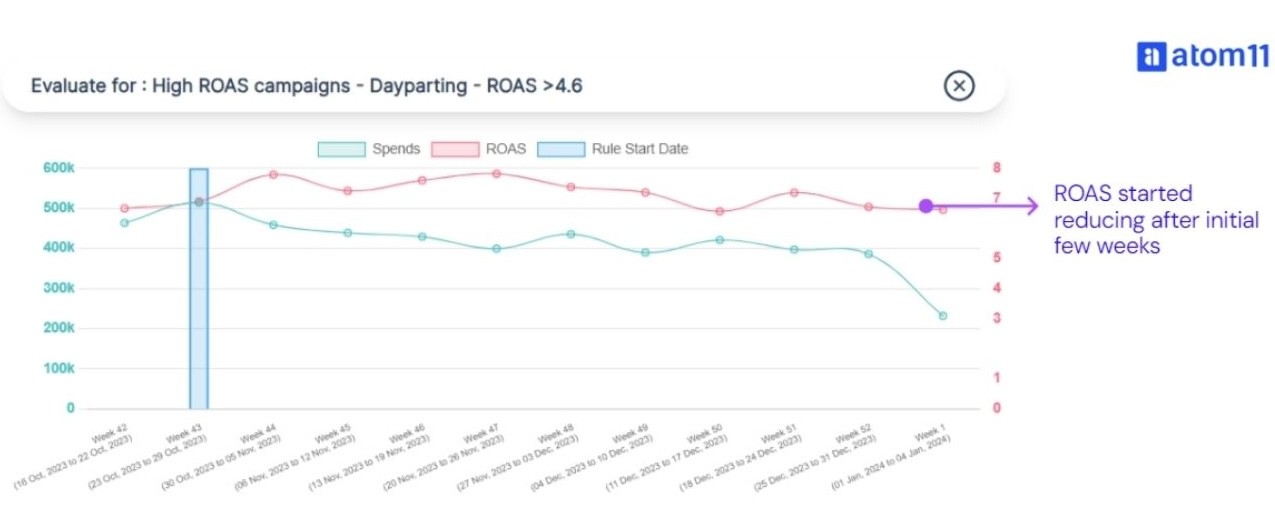
MOST IMPORTANTLY, ability to evaluate your dayparting
The last point is something that a lot of softwares just omit. Evaluation of dayparting strategy is super important, as the ROAS increment is marginal after 2 months. In such cases, you should be resetting your dayparting:
Conclusion:
Setting up a good dayparting strategy is all about the right data and right analysis. Today, we have tools to do this analysis for us and make life easier. Similarly, we can create dayparting strategies using tools to simplify our analytics and set up process. atom11 offers one of the most advanced dayparting set up and evaluation processes in the industry. You can book a call with us here, and we would love to take you through the complete demo.
FAQs
What is the optimal way to choose the best time slots for dayparting?
The optimal time slots for dayparting can be determined by analyzing historical performance data, such as the hours with the highest conversion rates or CTR (Click-Through Rates). Tools like Amazon’s Advertising Console or third-party software can help identify when your ads perform best, enabling you to schedule them during these peak times.
Can dayparting help reduce my ad spend?
Yes, dayparting can help reduce unnecessary ad spend by allowing you to allocate your budget during hours when customers are most likely to convert. This way, you avoid spending on hours with low engagement or conversions, optimizing the cost-efficiency of your campaigns.
How does dayparting affect campaign performance metrics like ACoS and ROAS?
Dayparting can positively impact ACoS (Advertising Cost of Sales) and ROAS (Return on Advertising Spend) by showing ads only during the most profitable times. When ads are shown during periods of higher engagement, it leads to better returns for the same ad spend, improving these metrics.
Is dayparting automated on Atom11, or do I need to manually adjust settings?
Atom11 automates the dayparting process by allowing users to set up rules that schedule ads based on historical performance data. Once the parameters are set, the system will automatically manage ad schedules to optimize performance, reducing the need for manual intervention.