Blog
/
Amazon Ads Reporting: What to Track and How to Use It
Amazon Ads Reporting: What to Track and How to Use It
Nivesh J
Key Takeaways
Amazon Ads reporting means reviewing campaign reports and metrics like ACoS, ROAS and TACoS to see what's working, what's wasting spend, and what to change next.
Amazon launched a unified reporting experience in November 2025, still in open beta, that replaces the old ~60-day data window with up to 15 months of daily data and 6 years of summary data.
Different reports answer different questions. Start with the business problem, not the report name.
ACoS, ROAS, and TACoS all measure efficiency, but at different levels: campaign, return, and whole-account.
A simple daily/weekly/monthly/quarterly cadence turns reporting from a spreadsheet habit into a decision-making routine.
Amazon gives you dozens of reports and no instructions on which one to open first. This guide cuts through that: what each report is for, which metrics actually matter, how often to check them, and what changed with Amazon's newest reporting update.
What Is Amazon Ads Reporting?
Amazon Ads reporting is the process of reviewing campaign data and metrics to understand ad performance. It covers impressions, clicks, spend, sales, ACoS, ROAS, search terms, placements, targets, and ASIN-level results, and it should answer one question every time you open it: what should I scale, pause, fix, or test next?
Amazon Just Overhauled Reporting: Here's What Changed
At its unBoxed 2025 event on November 11, 2025, Amazon Ads launched a unified reporting experience, currently in open beta. It consolidates the report builder UI, the reporting API, and Amazon Marketing Stream into one interface, so you can filter and combine data across ad products, accounts, and countries in one place instead of stitching together separate exports.
The bigger change is the data window. Standard Amazon Ads reports have historically covered roughly 60 days of history; some sources cite 65 which made year-over-year comparisons nearly impossible without your own archive. The new unified reporting gives advertisers up to 15 months of daily and weekly-grain data, and up to 6 years of monthly, yearly, and summary-grain data. That's long enough to compare this Black Friday to last Black Friday inside Amazon's own tools.
If you don't see this yet in your account, that's expected; it's still rolling out. Check your Ads console directly rather than assuming.
Which Report Answers Which Question
Start with the business problem you're trying to solve, not the report name.
If you need to know... | Use this report | What to do next |
Which shopper searches convert | Search term report | Add winners as exact/phrase keywords, add losers as negatives |
Which targets waste spend | Targeting report | Lower bids, pause targets, or refine |
Which ASINs deserve more budget | Advertised product report | Shift budget to stronger products |
Which placements perform best | Placement report | Adjust top-of-search or product page bids |
Whether spend is trending correctly | Performance over time report | Review pacing, seasonality, recent changes |
What shoppers bought after clicking | Purchased product report | Find cross-sell and halo sales opportunities |
Whether ads support total sales growth | TACoS and total sales dashboard | Compare ad spend against total account sales |
The Metrics Behind Every Report
CTR, CPC, CVR: Traffic and Listing Quality
CTR (Click-Through Rate)
CTR shows whether your ad gets attention when shoppers see it. A low CTR usually means weak creative, a poor main image, or targeting that's reaching the wrong audience.
Formula: Clicks ÷ Impressions
CPC (Cost Per Click)
CPC shows what each click actually costs you. Rising CPC without a matching rise in sales is an early sign of increased competition on a keyword or placement.
Formula: Spend ÷ Clicks
CVR (Conversion Rate)
CVR shows whether the clicks you're paying for actually turn into orders. A high CTR paired with a low CVR usually points to a listing problem, not an ads problem, raising bids won't fix a product page that doesn't close the sale.
Formula: Orders ÷ Clicks
ACoS vs. ROAS vs. TACoS: Which One to Trust
Metric | Formula | Best for | Watch out for |
ACoS | Ad spend ÷ ad sales × 100 | Campaign efficiency | Ignores total sales impact |
ROAS | Ad sales ÷ ad spend | Return per ad dollar | Can hide weak overall growth |
TACoS | Ad spend ÷ total sales × 100 | Whole-account efficiency | Needs total sales context to mean anything |
A campaign can show a strong ROAS while mostly capturing branded traffic that would have converted anyway. That's why TACoS matters: it's the only one of the three that tells you whether ads are growing the business or just replacing organic sales.
The Reports Worth Checking Every Week
1. Search Term Report
Shows the actual shopper searches that triggered your ads. Use it to find search terms with high clicks and no sales (add as negatives), and terms with low ACoS and steady orders (move to a manual exact campaign).
2. Targeting Report
Shows how your chosen keywords, ASINs, or categories perform. A target with high spend and no sales needs a lower bid or a pause; a target with low ACoS and steady orders can usually take more budget.
3. Placement Report
Shows performance by Top of Search, Rest of Search, and Product Pages. Don't raise placement bids just because a placement gets more clicks, and check whether those clicks turn into sales at a healthy cost first.
4. Advertised Product Report
Shows performance by ASIN. If a product gets clicks but no sales, the listing, not the ad, is usually the problem. Check the main image, title, price, reviews, and A+ content before raising bids further.
A Simple Reporting Cadence
Frequency | What to review | Action |
Daily | Spend pacing, budget outages, CPC spikes | Catch urgent issues, avoid changing bids unless there's a clear problem |
Weekly | Search terms, targeting, placement, ACoS | Adjust bids and negatives , most real improvements happen here |
Monthly | TACoS, ASIN performance, budget allocation | Reallocate budget, connect ad performance to total sales |
Quarterly | Channel mix, AMC, attribution, profit | Adjust full-funnel strategy and bigger budget decisions |
When Console Reports Aren't Enough: AMC and Attribution
Standard reports show what happened inside a single ad type. Amazon Marketing Cloud (AMC) is a privacy-safe clean room that unifies signals across ad types and your own first-party data, letting you build custom audiences and see the full path to conversion. AMC now offers a 25-month ad traffic lookback window, and Ads Agent in AMC (beta) lets you query it in natural language instead of SQL.
Use standard console reports for day-to-day campaign management. Move to AMC when you need to understand a customer journey that crosses multiple ad types, or when you need audience-level insight that standard reports can't give you.
How to Access and Export Amazon Ads Reports
Through the Amazon Ads Console
Sign in to the Amazon Ads console and open Measurement & Reporting from the left navigation.
Select Sponsored ads reports.
Click Create report.
Choose the advertising product (Sponsored Products, Sponsored Brands, Sponsored Brand Video, or Sponsored Display) and the report type (search term, targeting, placement, advertised product, etc.) based on the question you're trying to answer.
Set the reporting period and time unit (daily, weekly, or summary).
Select the columns or filters you need; don't pull every available column by default; extra columns just add noise to the export.
Run the report, then wait for it to process. Larger date ranges and account sizes take longer.
Download the report once it's ready, and save it with a consistent file name and date range if you'll be comparing periods later.
Through Seller Central
Sign in to Seller Central and open Reports from the top navigation.
Select Advertising Reports, or follow the link through to the advertising console.
Choose the campaign and report type you want.
Set the date range and any reporting options.
Run the report and download it once available.
Compare the results against your campaign goals rather than filing it away. A downloaded report that nobody reviews doesn't improve anything.
Exporting for Deeper Analysis
Most reports export as CSV, which opens cleanly in a spreadsheet for filtering and pivot tables. If you're pulling the same reports on a recurring basis, use consistent date ranges and file-naming conventions so period-over-period comparisons stay accurate.
For recurring or multi-account reporting, campaign data can be piped into Looker Studio or a custom dashboard, which saves you from manually re-exporting and reformatting the same report every week. Once the manual download-clean-combine cycle starts eating real time, that's usually the signal to move to automated reporting.
Common Amazon Ads Reporting Mistakes
Downloading reports without a question in mind. Start with the business problem, then pick the report, not the other way around.
Judging every campaign by ACoS alone. A higher ACoS isn't automatically bad if the campaign is supporting a launch or new-to-brand growth.
Changing bids every day based on daily data. Daily reporting should catch emergencies, not drive constant changes; save the real adjustments for your weekly review.
Never checking TACoS. A strong ROAS can mask flat total sales growth if a campaign is only capturing branded search.
How Atom11 Simplifies Amazon Ads Reporting
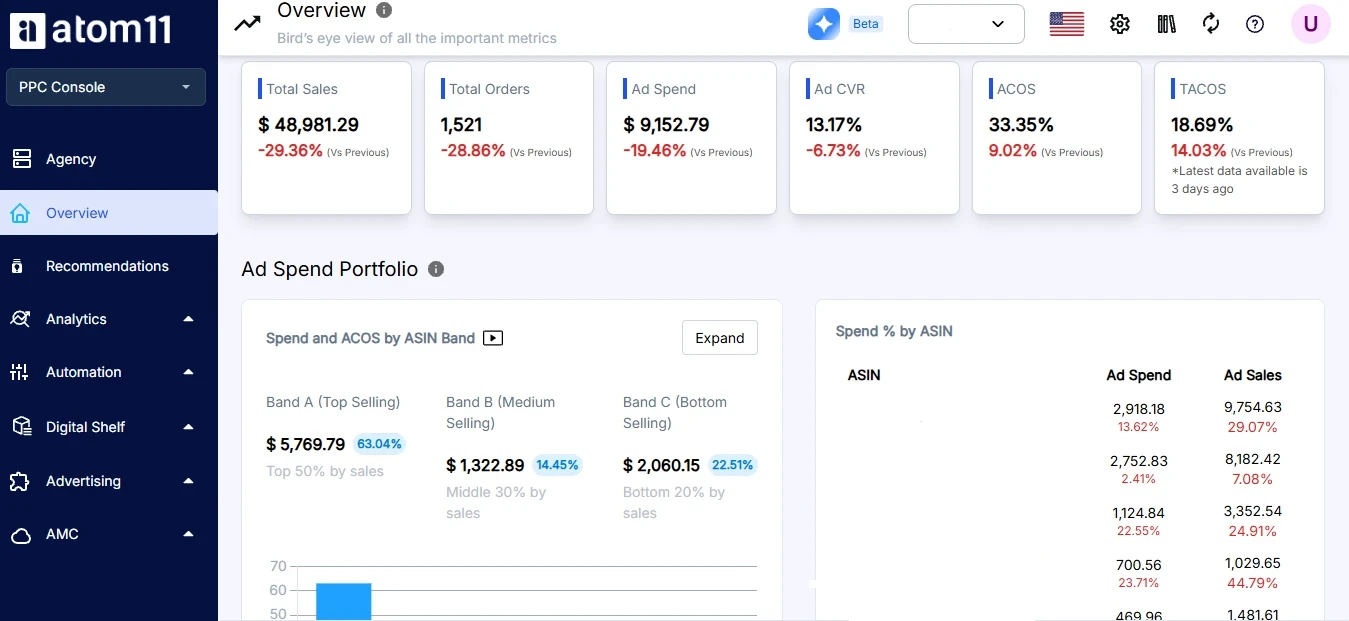
Atom11 brings advertising, pricing, inventory and retail data into one place. You're not stitching together exports from three different reports to answer one question.
Root Cause Analyzer
The Root Cause Analyzer flags which metrics actually moved and which didn't. Instead of scanning every report yourself, you see that orders dropped because ad spend and organic page views fell, not because of ten other things that didn't change.
Compare Mode
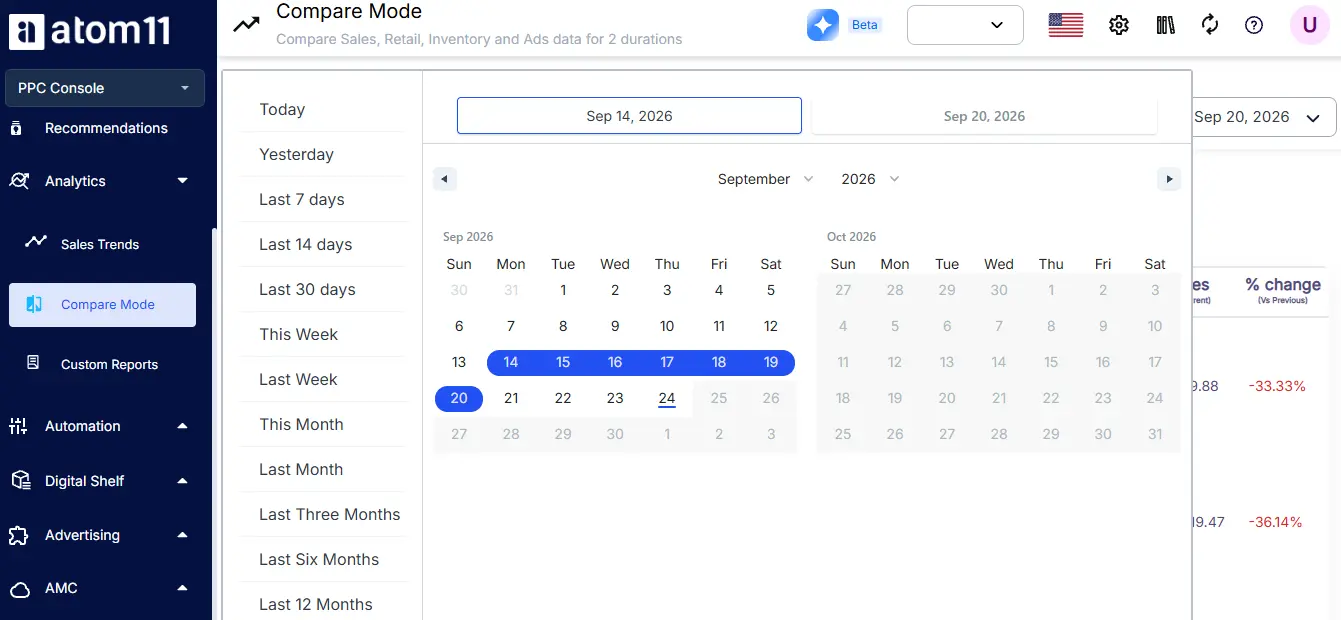
Set two time periods and get a detailed comparison at the ASIN level. Useful for checking a promotion's impact, a bid change's effect, or this month against last month, without rebuilding the comparison in a spreadsheet.
Hourly Data via Amazon Marketing Stream
Standard Amazon reports show one daily figure. Atom11's Amazon Marketing Stream integration breaks performance down by hour, so you can catch a mid-day ACOS spike instead of finding it the next morning. Gala used this hourly view to cut ACOS by 40% while increasing ad sales by 48%.
One Dashboard, Not Three Reports
Advertising, pricing, inventory and retail data sit together, so a question like "why did conversion drop" doesn't require pulling a PPC report, a pricing report and an inventory report separately and lining them up by hand.
Ask Neo
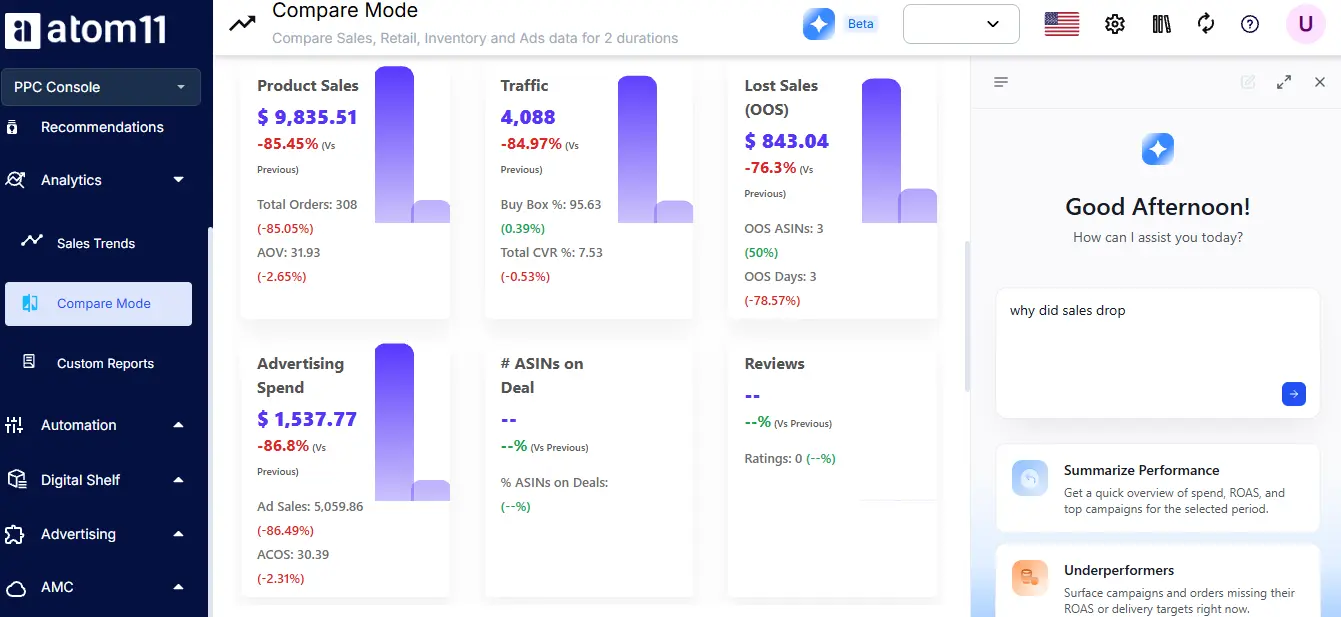
Neo is Atom11's AI copilot. Ask a plain-language question like "why did sales drop" and get an answer in seconds, across ads and retail data, instead of pulling three reports yourself.
A Reporting Workflow Example
Here's how the pieces fit together when something looks off:
Spot it: A daily spend or ACOS spike shows up in the hourly Marketing Stream view instead of waiting for tomorrow's report.
Diagnose it: Open the Root Cause Analyzer to see which metrics actually moved — spend, page views, price, stock — and which held steady.
Confirm it: Use Compare Mode to check the affected ASINs against the same period last week or last month.
Ask it: If the cause still isn't obvious, ask Neo directly instead of pulling additional reports.
Act on it: Adjust the bid, budget or listing based on the actual cause, not a guess.
Conclusion
Amazon Ads reporting only pays off when it leads to a decision. The reports themselves aren't the goal; a downloaded CSV that nobody acts on is just a spreadsheet.
Start with the question, not the report name. Let the business problem, wasted spend, weak ASINs, or flat growth point you to the right report. Match the metric to the question: ACoS for campaign efficiency, ROAS for return per dollar, and TACoS for whole-account truth.
Know your data window, check search term, targeting, placement, and advertised product reports regularly, and move to AMC when you need audience-level detail or insights across multiple ad types.
The sellers who get the most out of Amazon Ads reporting aren't the ones who check the most reports. They're the ones who ask the sharpest question first and separate daily noise from real trends.
Run reporting on a cadence: daily for emergencies, weekly for optimization, monthly for budget, and quarterly for strategy.
Want reporting that tells you what changed and why, without pulling three reports yourself? Book an Atom11 demo.
FAQs
What is Amazon Ads reporting?
Amazon Ads reporting is the process of reviewing campaign reports and metrics impressions, clicks, spend, sales, ACoS, ROAS, and more to understand ad performance and decide what to scale, pause, fix, or test next.
What is the most important Amazon Ads report to check first?
The search term report is the best starting point for most sellers. It shows the actual shopper searches triggering your ads, which quickly surfaces both winning keywords and wasted spend.
What's the difference between ACoS, ROAS and TACoS?
ACoS shows ad spend as a percentage of ad sales. ROAS shows revenue generated per ad dollar. TACoS shows ad spend as a percentage of total sales, including organic; it's the only one that reveals whether ads are actually growing the business.
Can I automate Amazon Ads reporting?
Yes. You can pull data through the Amazon Ads reporting API into a dashboard, or use PPC software that surfaces the relevant metrics and flags root causes automatically instead of requiring manual report-pulling every week.
When should I use Amazon Marketing Cloud instead of standard reports?
Use standard console reports for day-to-day campaign management. Move to AMC when you need to understand a customer journey across multiple ad types or build custom audiences that standard reports can't produce.
