Blog
/
Amazon Vendor Central PPC Budget Planning: How to Set, Split and Reforecast Your Ad Budget
Amazon Vendor Central PPC Budget Planning: How to Set, Split and Reforecast Your Ad Budget
Nivesh J.

KEY TAKEAWAYS
Build your annual PPC budget using target TACoS and ASIN-level spending plans.
Calculate break-even ACOS using wholesale price, cost of goods and coop fees.
Split budgets into Defend, Grow and Launch tiers with separate ACOS targets.
Allocate monthly ad spend using historical demand and seasonal trends.
Keep a budget reserve for peak periods and account for Amazon's daily budget flexibility.
Adjust ad spend based on stock cover, purchase orders, cash flow and monthly performance.
Quick answer: Plan a Vendor Central PPC budget in five steps. Set a ceiling from your coop adjusted break even ACOS, size the annual envelope top down from a target TACoS and bottom up from ASIN tiers, spread it across months with a seasonality index, hold back a reserve, and limit spend by stock. Amazon’s vendor advertising guide states no minimum budget and says only to budget enough for impressions, clicks and sales, so the numbers must come from your own margin.
What Is Amazon Vendor Central PPC Budget Planning?
Vendor Central PPC budget planning is the process of deciding how much to spend on Sponsored Products, Sponsored Brands and Stores for a year, a quarter and each product, based on what your margin can afford. It differs from a seller budget because a vendor earns the wholesale price, pays coop and is billed for ads in its own way.
The five layers below build on each other, and each one gets its own section.
Layer | Question it answers | Main input |
|---|---|---|
1. Ceiling | What is the most we can spend before ads lose money? | Coop adjusted break even ACOS |
2. Envelope | How big should the annual budget be? | Target TACoS and ASIN tier plan |
3. Calendar | When should the money be spent? | Seasonality index |
4. Constraints | What limits spend? | Stock, purchase orders, cash flow |
5. Reforecast | When do we change the plan? | Monthly headroom and reserve rules |
How Much Should a Vendor Budget for Amazon PPC?
There is no public benchmark that fits every vendor. Amazon’s vendor advertising guide lists no minimum budget, so start with a top down figure from a target TACoS and check it against a bottom up plan by ASIN.
Annual ad budget = Planned ordered revenue × Target TACoS
Example (illustrative). A vendor plans $5,000,000 of ordered revenue at shopper prices and targets a TACoS of 5.5%. The top down budget is 5,000,000 × 0.055 = $275,000. Say which revenue view you use, because TACoS on shipped revenue at wholesale is higher for the same spend, and keep the same view all year. Our guide to Vendor Central PPC reporting metrics explains the difference.
The target TACoS is a decision, not a fact. Choose it from what your ASINs can afford, which is the next question.
What Is the Most a Vendor Can Spend Before Ads Lose Money?
The most you can spend on ad driven sales is your ad sales times your break even ACOS, and a vendor must subtract coop from the margin before it calculates that. Spending above the ceiling loses money on every sale it buys, unless you have a deliberate reason, such as a launch.
Net margin per unit = Wholesale price minus Cost of goods minus (Wholesale price × Coop rate)
Break even ACOS = Net margin per unit ÷ Retail price
Spend ceiling = Ad sales × Break even ACOS
Example (illustrative). A product retails for $40, Amazon pays $26 wholesale, cost of goods is $14 and coop is 10% of wholesale ($2.60). Net margin is $9.40 and break even ACOS is 9.40 ÷ 40 = 23.5%. On $800,000 of ad sales, the ceiling is $188,000. Our guide to Vendor Central coop fees and PPC ROI shows how the answer moves with your coop rate.
How Do You Build a Vendor PPC Budget by ASIN Tier?
Group ASINs into tiers by the job their ads do, give each tier its own ACOS target, and budget each tier as target ad sales times target ACOS. Tiers stop a brand term that earns a 10% ACOS from subsidizing a launch that does not.
Tier | Job | Target ACOS | Ad sales plan | Budget | Contribution after ads |
|---|---|---|---|---|---|
Defend | Brand terms and own products | 10.0% | $600,000 | $60,000 | $81,000 |
Grow | Core category terms | 18.5% | $800,000 | $148,000 | $40,000 |
Launch | New ASINs and conquest | 30.0% | $200,000 | $60,000 | Loss of $13,000 |
Total | 16.8% | $1,600,000 | $268,000 | $108,000 |
The contribution column uses the 23.5% break even from above, so each tier’s contribution is ad sales × 23.5% minus its budget. The Launch tier is planned below break even, which turns its $13,000 loss into a capped investment, and the table shows what the other tiers must earn to pay for it.

Bar chart of illustrative annual budget and contribution after ads for the Defend, Grow and Launch tiers, with the Launch tier showing a planned 13,000 dollar loss
Figure 1: Illustrative budget and contribution by tier.
Reconcile the two methods. The bottom up total of $268,000 sits within 3% of the $275,000 top down figure. If the two differ by more than about 10%, cut the tier with the least ACOS headroom first. That 10% is a rule of thumb from this guide, not an Amazon rule.
How Do You Spread a Vendor PPC Budget Across the Year?
Spread the annual budget with a seasonality index built from last year’s ordered units, so each month’s budget follows demand. Monthly budget equals the annual budget times the month’s index divided by 12, where an index of 1.0 is an average month.
Monthly budget = Annual budget × Month index ÷ 12
Example (illustrative). After a 10% reserve, the plan has $241,200 to allocate, which is $20,100 in an average month. The indexes below come from an invented demand curve, and they average 1.0.
Month | Index | Budget | Month | Index | Budget |
|---|---|---|---|---|---|
January | 0.80 | $16,080 | July | 1.15 | $23,115 |
February | 0.80 | $16,080 | August | 0.90 | $18,090 |
March | 0.90 | $18,090 | September | 0.95 | $19,095 |
April | 0.90 | $18,090 | October | 1.05 | $21,105 |
May | 0.95 | $19,095 | November | 1.45 | $29,145 |
June | 0.95 | $19,095 | December | 1.20 | $24,120 |

Bar chart of illustrative monthly Vendor Central PPC budgets from 16,080 dollars in January to 29,145 dollars in November, based on a seasonality index
Figure 2: Illustrative monthly budget from a seasonality index.
Build your own index from your ordered units, not from ad spend, so you are following demand and not last year’s decisions. Where Prime Day or another event falls in your year, give that month its own bump, as July has here.
How Should Vendors Budget for Q4, Prime Day and Black Friday?
Give peak months a higher index, keep a reserve for them, and and plan for Amazon’s daily averaging. Amazon’s daily budgeting policy lets a campaign spend up to 100% more than its daily budget on a single day, averaged over the month, and lets you choose a 25% or 100% limit.
Highest single day spend = Daily budget × (1 + limit)
Example (illustrative). A $1,000 daily budget at a 100% limit can spend $2,000 in one day. In November, with a $29,145 plan, that means a monthly cap matters more than any one day’s number, so check month to date spend against plan and not against yesterday’s budget. Our guide to Amazon PPC budget management software covers pacing ratios and rule ceilings.
Two more peak rules apply to vendors. Amazon’s vendor advertising guide counts a sale when a shopper clicks an ad and buys within 14 days, so judge a peak flight only after that window has passed. And peak demand can outrun your purchase orders, so set peak budgets only after you check stock, as the stock section below explains.
Should Vendor Central PPC Budget Come From Coop or a Separate Line?
Treat ad spend as its own line next to coop, because we could not find a published rule that ad spend reduces coop. Ask your vendor manager in writing whether ad spend counts toward any marketing commitment.
Coop is taken from your payments under your vendor terms, and ad spend is a separate cost, so budget planning needs both on one page. A useful number is the total marketing load.
Total marketing load = (Coop + Ad spend) ÷ Wholesale revenue
Example (illustrative). Ordered revenue of $5,000,000 at $26 wholesale on a $40 retail price is $3,250,000 of wholesale revenue. Coop at 10% is $325,000 and the ad plan is $268,000, so the total load is 593,000 ÷ 3,250,000 = 18.2% of wholesale revenue. The ad plan alone is 8.2%.

Stacked bar of illustrative total marketing load for a vendor: 325,000 dollars of coop and 268,000 dollars of ad spend on 3.25 million dollars of wholesale revenue, 18.2 percent in total
Figure 3: Illustrative total marketing load, coop plus ads.
Use the load number in your annual vendor negotiation. It shows the buyer what the brand already pays to market on Amazon, and it makes a coop discussion about the whole cost and not one line.
How Is Vendor Advertising Paid For, and Does It Change the Budget?
Vendors pay for ads with a credit card or with Deduct from Payment, which draws on retail proceeds, and the method changes how a budget overrun reaches your cash. Amazon’s vendor guide says you can switch between the two at any time.
Payment method | How it works | Planning effect |
|---|---|---|
Credit card | Ad costs are charged to a personal or corporate card | Ad spend is a separate cash outflow |
Deduct from Payment | Ad costs are drawn from your Amazon retail proceeds | An overspend reduces the next payment |
Amazon says Deduct from Payment is not available to third parties who manage payments for clients’ ad accounts, or to accounts with no retail activity in the last 6 months. Agencies should check who holds the billing relationship before they plan around it.
PPC Land reported that Amazon planned to move a small group of advertisers it contacted directly from card billing to account balance deduction or Pay by Invoice. Check the Billing section of your ads console for the options that apply to your account, and model ad spend as a cash line in the month it is billed.
How Should Stock and Purchase Orders Limit a Vendor PPC Budget?
Cap spend on any ASIN that cannot support the demand it creates, because a vendor cannot always restock quickly and a stockout wastes the ad budget. Compare weeks of cover with the weeks until your next purchase order, and release the budget of ASINs that fall short.
Cover ratio = Weeks of cover ÷ Weeks until the next purchase order
A ratio below 1.0 means the ASIN is expected to run out before more stock arrives. Move its budget to a Defend or Grow ASIN with healthy cover until the order lands. Our guide to Vendor Central inventory and ad performance shows the full calculation and a stockout cost example.
How Do You Reforecast a Vendor PPC Budget During the Year?
Review the plan monthly against three checks, headroom by tier, spend against the monthly plan and stock cover, and release the reserve only where headroom is positive. The reserve is a share of the annual budget you hold back, and a 10% reserve is a judgment from this guide, not an Amazon rule.
Signal | What it means | Action |
|---|---|---|
Tier ACOS below target, stock healthy | Headroom is positive | Release reserve to that tier |
Tier ACOS above break even | Tier is losing money | Cut the budget and fix targeting first |
Spend ahead of plan by more than 10% | Pacing is too fast | Slow daily budgets for the rest of the month |
Spend behind plan with ACOS on target | Budget is limiting results | Raise budgets, or check bids and stock |
Cover ratio below 1.0 | Stockout risk | Move budget to ASINs with cover |
Coop rate or wholesale price changes | Break even moved | Recalculate every tier target |
Example (illustrative). With a $26,800 reserve and four quarterly releases, hold back $6,700 each time. If Grow beats its 18.5% target by three points and has stock, send it that quarter’s release.
How Can Atom11 Help Manage a Vendor Central PPC Budget?
Atom11 supports Vendor Central ad accounts, including Sponsored Products and Sponsored Brands for vendors, and runs budget changes on rules you set, using inventory, price, Buy Box and organic rank next to ad metrics. It holds cost of goods per ASIN but not your coop rate, so the coop adjusted break even in this guide stays in your own model.
Planning job | How Atom11 handles it |
|---|---|
Vendor account support | Ad accounts registered through Vendor Central or Advantage Central |
Vendor reports | Pulls in Sales Diagnostic, inventory, traffic and net PPM, but not profit |
Budget changes | Budget rules that raise or lower campaign budgets, and a portfolio budget optimizer |
Stock limits | An inventory optimizer that pauses advertised ASINs on low stock and resumes them after restock |
Margin inputs | Cost of goods per ASIN, but not the coop rate |
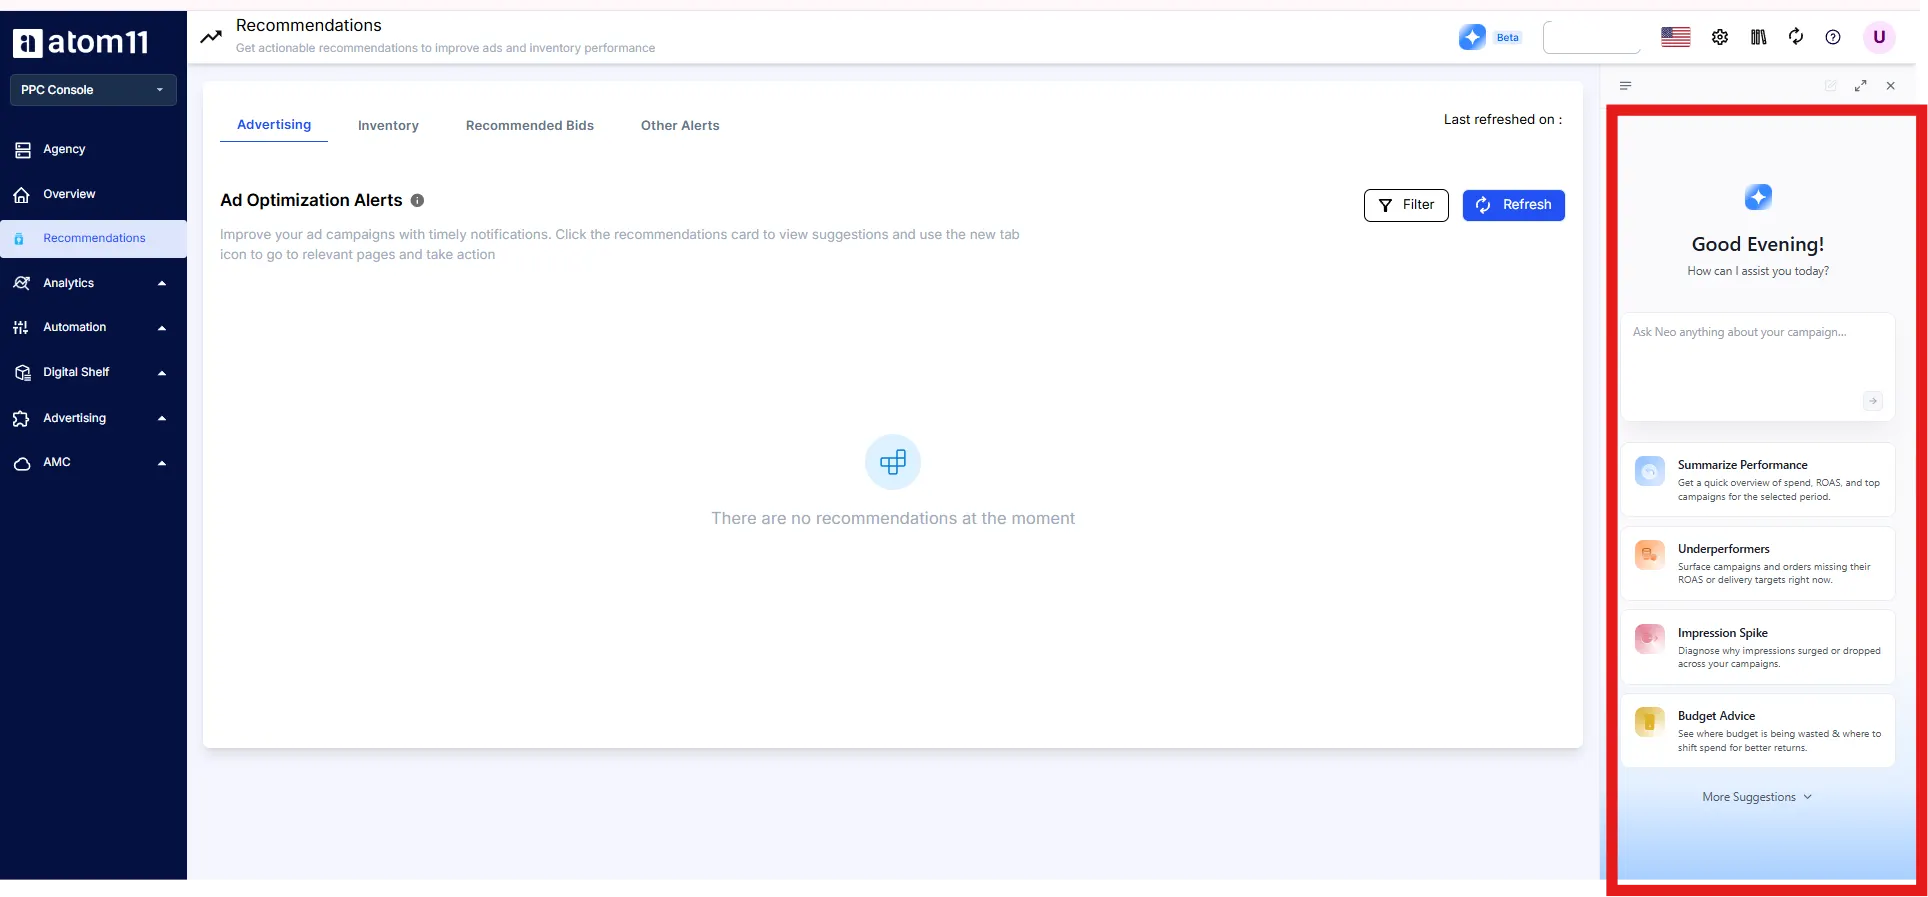
Reforecast analysis | Neo compares periods across more than 15 ad and retail signals |
Safety | Version control to roll back bids and budgets, and a Performance Monitor with a before and after record |
History | Search term history stored beyond Amazon’s roughly 60 to 65 day window |

Atom11 gives you rule control, so it suits teams that want to own their budget plan and keep every change explainable, and it is a weaker fit for anyone wanting a fully hands off autopilot. If you plan to a strict monthly cap, ask in a demo how Atom11 tracks pacing against it, and how its inventory optimizer works with purchase order timing. The Atom11 Amazon PPC platform is priced by monthly ad spend, and every tier includes Neo and the MCP.
Monthly ad spend | Monthly price |
|---|---|
Under $50K | $499, without Marketing Stream data or AMC |
$50K to $100K | $1,200 |
$100K to $200K | $1,700 |
$200K to $300K | $2,700 |
$300K to $400K | $3,700 |
$400K to $500K | $4,700 |
$500K and above | Customized pricing |
Check current inclusions on the pricing page, or book a demo and bring your ASIN tiers and a monthly plan to test against.
Conclusion
A good vendor PPC budget is built backward from margin. Start with the ceiling that your coop adjusted break even ACOS allows, size the annual envelope two ways and reconcile them, split it by what each ASIN tier is for, and spread it with a seasonality index that follows demand. Then hold a reserve, check the plan against stock and cash, and release money only where headroom is real.
The budget that results is not a forecast to defend, but a plan to revise. Review it monthly, keep ad spend on its own line next to coop, and use the total marketing load when you sit down for annual negotiations. The numbers here are illustrations, so the work that matters is putting your own wholesale price, cost of goods and coop rate through the same steps.
All worked numbers are illustrative, so replace them with your own wholesale price, cost of goods and coop rate.

FAQs
How much should a vendor spend on Amazon PPC?
There is no public benchmark that fits every vendor, and Amazon’s vendor advertising guide states no minimum budget. Set the budget from your own margin: multiply planned ordered revenue by a target TACoS, then check it against a bottom up plan by ASIN tier and your coop adjusted break even ACOS.
How do I set a Vendor Central PPC budget?
Calculate net margin per unit after cost of goods and coop, divide by retail price to get break even ACOS, set a target ACOS for each ASIN tier, and multiply target ad sales by target ACOS to get each tier’s budget. Then spread the total across months with a seasonality index.
Is Amazon ad spend deducted from Vendor Central payments?
It can be. Amazon’s vendor advertising guide says vendors can pay with a credit card or with Deduct from Payment, which draws on retail proceeds, and that vendors can switch between them at any time. Deduct from Payment is not available to third parties managing payments for clients or to accounts with no retail activity in the last 6 months.
Does Vendor Central ad spend reduce my coop?
We could not find a published rule that ad spend reduces coop, so do not assume it does. Ask your vendor manager in writing whether any ad spend counts toward a marketing commitment, and budget coop and ads as separate lines until you have the answer in writing.
How do I plan a Vendor Central PPC budget for Q4?
Give the peak months a higher seasonality index, hold a reserve for them, check stock cover against purchase order timing, and judge peak flights on settled data, because Amazon counts a sale when a shopper buys within 14 days of a click. Amazon’s daily budgeting policy lets a campaign spend up to 100% more than its daily budget on one day, so track the month to date total.
