Blog
/
Amazon Vendor Central PPC Reporting: The Metrics That Matter
Amazon Vendor Central PPC Reporting: The Metrics That Matter
Nivesh J.

KEY TAKEAWAYS
Judge ACOS against your own break even, not a benchmark. In our worked example, a vendor with a 23.5% break even ACOS sees a blended 18.4% ACOS look safe while one campaign runs 5.5 points over break even and loses $1,650.
The denominator of TACoS changes the answer. In our example, the same $25,800 of ad spend gives a TACoS of 6.5% on ordered revenue and 9.9% on wholesale revenue.
Three data sets will not match. Ad console sales, Vendor Central retail reports and your invoices measure different things, so reconcile them monthly instead of trying to force them to agree.
Read results on a delay. Amazon’s vendor guide says a sale is attributed when a shopper clicks and buys within 14 days, so recent days are provisional.
Atom11 puts ads, retail and pricing data in one view. Its dashboard, compare mode, Root Cause Analyzer and exports to Power BI, Google Sheets and Looker cover most of a vendor reporting stack.
Quick answer: A vendor should report six PPC metrics: ad spend, ad attributed sales, ACOS measured against your own break even ACOS, TACoS on a stated revenue view, new to brand share and stock cover on advertised ASINs. The reason is simple: the ad console shows sales at the shopper’s price, but a vendor earns the wholesale price less allowances, so a standard seller dashboard can show a healthy ACOS on a campaign that loses money.
Amazon’s console and reports are changing as Amazon Ads Agent rolls out, so confirm report names and definitions in your own account.
Which PPC Metrics Matter Most for Vendor Central Reporting?
Report the metrics that answer four questions: what did we spend, what did it sell, did it pay, and can we fulfil it. The table below orders them by how often you should look.
Metric | Formula | Why it matters for a vendor | Watch out for |
|---|---|---|---|
Ad spend | Sum of clicks times cost per click | The cost side of every other metric | Budgets can overspend on a given day, so read spend by day |
Ad attributed sales | Sales credited to ad clicks in the attribution window | The revenue side of ACOS and ROAS | Shown at the shopper’s price, not your wholesale price |
ACOS | Ad spend ÷ ad attributed sales | The standard efficiency metric | Only meaningful against your break even ACOS |
ACOS headroom | Break even ACOS minus actual ACOS, in points | Tells you how much room is left before the campaign loses money | Needs a correct net margin, including allowances |
TACoS | Ad spend ÷ total sales | Shows whether ads are building or replacing organic sales | State which revenue view you use |
New to brand share | New to brand orders ÷ total orders | Shows whether spend finds new shoppers | Amazon lists new to brand metrics as a vendor ad tool |
Stock cover on advertised ASINs | Sellable units ÷ forecast units per week | Prevents paying for demand you cannot ship | Vendors cannot always restock fast |
CTR, CVR and CPC | Clicks ÷ impressions, orders ÷ clicks, spend ÷ clicks | Diagnostic metrics that explain a change in ACOS | Read them after the first six, not before |
Our guide to Amazon ACOS and TACOS covers the seller definitions, and our Amazon Ads reporting guide covers the report types in more depth.
Why Do Vendor PPC Reports and Vendor Central Sales Reports Never Match?
They never match because they are three different ledgers, each measuring a different thing at a different time. Treat them as three views of one business, not three versions of the same number.
Ledger | Where it lives | What it measures | Typical use |
|---|---|---|---|
Ad ledger | Advertising console | Shopper orders credited to ad clicks, at shopper prices, by interaction date | Campaign efficiency |
Retail ledger | Vendor Central retail reports | Sales and units, including what Amazon paid you for shipped goods | Total sales, stock, margin views |
Money ledger | Invoices and payments | What Amazon pays, less coop, allowances and chargebacks | Real profit |
Industry guides add two vendor specific warnings. Some vendor attributed sales may reflect wholesale purchase orders instead of shopper purchases, which makes weekly ACOS noisier, and ad console sales and Vendor Central sales update on different schedules. One guide advises judging campaign ACOS as a trend over 14 to 28 days instead of reacting to a weekly swing.

Figure 1: The three ledgers behind vendor PPC reporting.
Our guide to coop fees and PPC ROI shows how the money ledger changes break even ACOS.
How Do You Calculate TACoS as a Vendor?
Divide ad spend by total sales, and say which sales figure you used, because a vendor has more than one. The same spend gives a different TACoS depending on whether total sales are measured at shopper prices or at what Amazon paid you.
Formula: TACoS = Ad spend ÷ Total sales
Illustrative example. You spend $25,800 on ads in a month. Ordered revenue at shopper prices is $400,000. At a $26 wholesale price on a $40 retail price, the wholesale equivalent is about $260,000.
Revenue view used as total sales | Total sales | TACoS |
|---|---|---|
Ordered revenue, at shopper prices | $400,000 | 6.5% |
Shipped revenue, at wholesale | $260,000 | 9.9% |
One industry guide describes shipped revenue as what Amazon paid the vendor, not what the customer paid Amazon. The two views also differ in timing, so confirm the definition of each report in your own account. Pick one view, write it at the top of the report and keep it for every month. A TACoS that falls because you switched views is not an improvement.
What Is ACOS Headroom, and Why Is It the Best Vendor KPI?
ACOS headroom is your break even ACOS minus your actual ACOS, in percentage points, and it tells a vendor how much margin an ad campaign has left. A positive number means the campaign is profitable, and a number below zero means it is losing money.
Formulas:
Break even ACOS = Net margin per unit ÷ Retail price
ACOS headroom = Break even ACOS minus Actual ACOS
Worked example (illustrative). A product retails for $40, Amazon pays $26 wholesale, cost of goods is $14 and a 10% coop rate takes $2.60. Net margin is $9.40, so break even ACOS is 23.5%. Three campaigns report these results.
Campaign | Ad spend | Ad sales | ACOS | Headroom | Profit after ads |
|---|---|---|---|---|---|
Brand terms | $4,500 | $50,000 | 9.0% | 14.5 points | $7,250 |
Category terms | $12,600 | $60,000 | 21.0% | 2.5 points | $1,500 |
Competitor targeting | $8,700 | $30,000 | 29.0% | 5.5 points over break even | Loss of $1,650 |
All campaigns | $25,800 | $140,000 | 18.4% | 5.1 points | $7,100 |

Bar chart of ACOS headroom for three vendor campaigns against a 23.5 percent break even ACOS, with brand terms 14.5 points under, category terms 2.5 points under and competitor targeting 5.5 points over
Figure 2: Illustrative ACOS headroom by campaign against a 23.5% break even.
The blended ACOS of 18.4% looks comfortable, but it hides a campaign that loses $1,650. Report headroom by campaign, not just in total. Our guide to getting started with Vendor Central advertising explains how to set the break even in the first place.
How Do Coop Fees Change the PPC Metrics You Report?
Coop changes the break even in your ACOS headroom calculation, not the ACOS the console shows. The console reports sales and spend, so it knows nothing about your allowances.
Report ACOS as the console shows it. Do not edit the source number.
Compute headroom with a coop adjusted break even. Subtract percentage based allowances from wholesale price before you work out net margin.
Leave fixed fees out of campaign reports. A fixed straight payment is owed whether or not a campaign runs.
Label the coop rate you used. Write the rate on the report, so a change in terms is visible next quarter.
How Long Should a Vendor Wait Before Reading PPC Results?
Wait at least 14 days after a launch or a big change, and treat the most recent days as provisional. Amazon’s vendor advertising guide says sales are attributed when a shopper clicks an ad and buys within 14 days.
Sources differ on windows by ad type, so check the window shown in your own reports.
Ad type | Window reported by industry documentation for vendors | Note |
|---|---|---|
Sponsored Products | 14 days, click based | Industry sources list 7 days for sellers |
Sponsored Brands | 14 days, click based | Some sources list a different figure, so verify in your account |
Sponsored Display | 14 days, click based | Display attribution rules vary by product |
Two habits keep reports honest. Mark any date inside the window as provisional. And compare like windows, for example a launch week against the same week a month earlier, not against a settled period.
Which Vendor PPC Reports Should You Review Daily, Weekly and Monthly?
Review stock and spend pacing daily, headroom and TACoS weekly, and the three ledgers and coop adjusted profit monthly. A fixed cadence keeps small problems from becoming month end surprises.
Cadence | What to review | Decision it supports |
|---|---|---|
Daily | Spend against budget, stock cover on advertised ASINs, any ASIN that lost the Featured Offer | Pause, cap or slow spend |
Weekly | ACOS headroom by campaign, TACoS, new to brand share, top and bottom search terms | Move budget, change bids, harvest or negate terms |
Monthly | Reconciliation of ad, retail and money ledgers, coop adjusted profit, incrementality checks | Reset targets, plan the next quarter, prepare for vendor negotiations |
How Do You Find Out Why Vendor Ad Sales Dropped?
Check the causes outside the ad account first, because a drop in attributed sales is often a stock, price or Featured Offer problem, not a bidding problem. Work down this list in order.
Step | Check | What it tells you |
|---|---|---|
1 | Stock and purchase orders on the ASIN | Whether you ran out or Amazon stopped ordering |
2 | Featured Offer and price | Whether the listing is still winning the main offer |
3 | Organic page views and rank | Whether demand fell, not just ad performance |
4 | Ad spend and impressions | Whether budget capped out or bids fell |
5 | Conversion rate | Whether content, reviews or price changed |

Five step diagnostic order for a vendor sales drop: stock and purchase orders, Featured Offer and price, organic views, ad spend, conversion rate
Figure 3: Check stock, offer and demand before touching bids.
Which Metrics Belong in an Agency or Leadership Vendor Report?
Give each audience three or four metrics that match the decision it makes. Leadership needs profit and growth, the brand team needs campaign levers, and the agency needs proof of work.
Audience | Metrics to lead with |
|---|---|
Leadership | Profit after ads, TACoS on a stated view, ad share of total sales |
Brand or category manager | ACOS headroom by campaign, new to brand share, stock cover |
Agency lead | Wasted spend found and fixed, changes made with before and after results, incrementality notes |
How Does Atom11 Support Vendor Central PPC Reporting?
Atom11 gives vendors one place to read ad performance next to retail and pricing data, with tools to explain a change and to export the result. Atom11 is an Amazon Ads Partner platform built for sellers, vendors and agencies. Its demo describes an analytics view that brings together advertising data and data from Seller Central or Vendor Central, covering advertising, pricing, inventory and retail. It supports Vendor Central ad accounts, meaning the console registered through Vendor Central or Advantage Central, with Sponsored Products and Sponsored Brands for vendors. It pulls in Vendor Central reports such as Sales Diagnostic, inventory, traffic and net PPM, but it does not pull in profit.
Can One Dashboard Show Ads, Retail and Pricing Data Together?
Yes. Atom11’s analytics tab trends ad spend against metrics such as best seller rank, total sales, TACoS and conversion in one place, and the data is available by day, week or month, at parent or child ASIN level. You can create labels and tags for groups of products and view them as a growth time series or a cumulative view. For a vendor, that makes the stock and Featured Offer checks in the diagnostic table above part of the same screen as spend.
The overview page covers spend, not just results:
Spend by ASIN type, campaign type and placement, so you can see where money goes.
Spend by search term type, split into branded, competition and generic terms.
Spend by target type, including match types, product targeting and auto campaigns.
Performance on expand, so branded, competition and generic results sit next to their spend.
How Do Compare Mode and the Root Cause Analyzer Explain a Drop?
Compare mode lets you select two time periods and see a detailed comparison at ASIN level, and the Root Cause Analyzer then shows which metrics changed and which did not. In the demo example, orders fell because ad spend, ROAS and page views all fell, so the reader could ignore stock and average order value and focus on advertising and organic page views. That is the same order as the diagnostic table above, compressed into a few clicks.

What Can Neo and the Atom11 MCP Answer for Vendors?
Neo is Atom11’s AI analyst, and it compares periods across more than 15 ad and retail signals to explain why sales or ACOS moved. Questions it handles include “which products are currently in ineligible status” and “why did sales drop for this parent ASIN.” The Atom11 MCP lets AI assistants such as Claude, ChatGPT and Cursor reach the same governed data, and setup takes about five minutes with no terminal and no data pipeline. In one case a household products brand’s top products fell 29% in sales while ad spend rose 70%. Neo found the cause outside the ad account, and the brand later grew sales by 200%. The same brand also cut its analytics time by 93% with Ask Neo and the MCP.
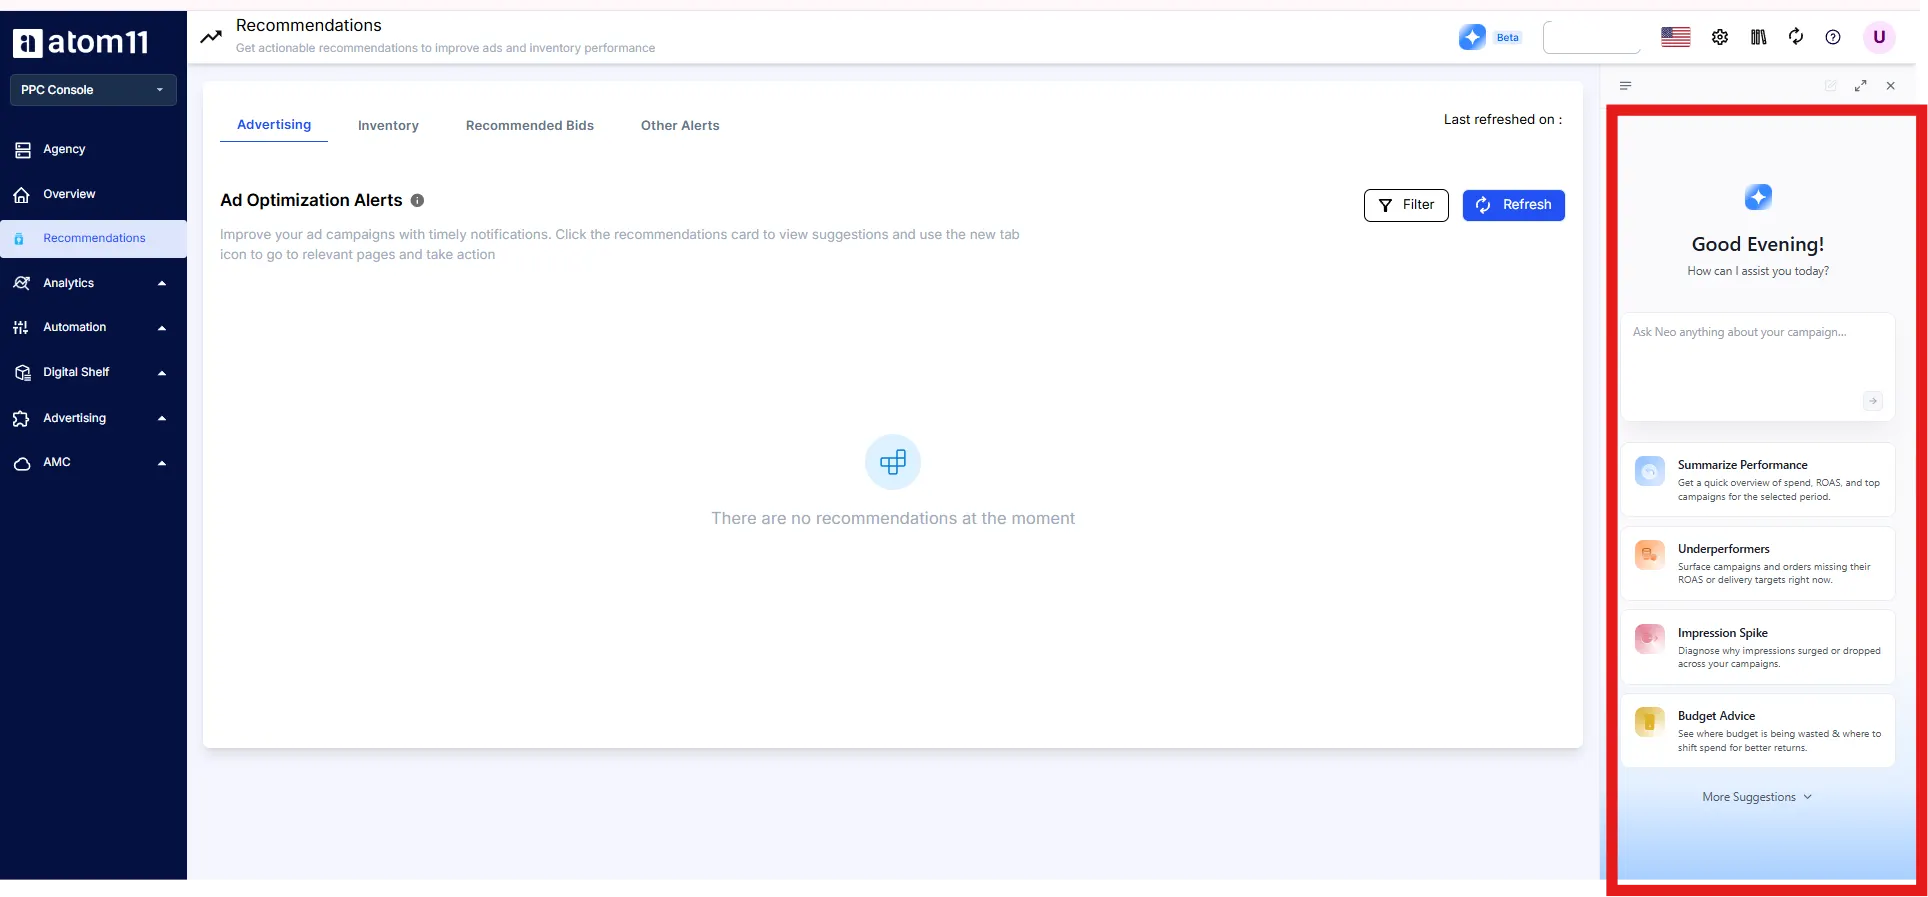
How Do You Report to Clients and Leadership From Atom11?
Use the agency view for the portfolio, then the dashboard exports for each audience. The agency page lists every onboarded account, with a date range and an export, so a brand with several sub brands or an agency with many clients can scan them together. Custom reporting connects to Power BI, Google Sheets and Looker, so the ACOS headroom and TACoS tables above can live in the tools your team already uses.

How Does Atom11 Record What Automations Changed?
Version control saves bids and budgets, so you can roll back after Prime Day or Black Friday, and the Performance Monitor shows a before-and-after record for each automation. For reporting, that means a change in ACOS can be traced to a named change instead of guessed at. Digital shelf tracking also monitors competitors and ad suppressions.

What Does Atom11 Cost for Vendor Reporting?
Atom11 PPC pricing is tiered by monthly ad spend, and every tier includes Neo and the MCP.
Monthly ad spend | Monthly price |
|---|---|
Under $50K | $499, without Marketing Stream data or AMC |
$50K to $100K | $1,200 |
$100K to $200K | $1,700 |
$200K to $300K | $2,700 |
$300K to $400K | $3,700 |
$400K to $500K | $4,700 |
$500K and above | Customized pricing |
See the pricing page for current inclusions.
What Is a 30 Minute Monday Vendor Review in Atom11?
Run these five steps each week, and the cadence table above becomes a habit.
Open the agency view or overview page and note any account or ASIN type where spend moved.
Use compare mode to compare the last full week with the one before, at ASIN level.
Open the Root Cause Analyzer on any ASIN that moved, and check stock and Featured Offer signals before bids.
Ask Neo about ineligible products and any unexplained sales drop.
Export the report to your sheet or BI tool, add your headroom column and write the revenue view and coop rate at the top.
What Should You Still Check Yourself?
Verify your own margin inputs, because no ad platform knows your signed terms. Atom11 shows ad and retail signals and can hold cost of goods per ASIN, but it does not pull in profit and does not hold your coop rate. Your wholesale price and coop rate come from your vendor agreement, so keep the coop adjusted calculation in your own model.
Want one view of vendor ads, stock and pricing? Book an Atom11 demo.
Conclusion
Vendor PPC reporting is a margin problem before it is a dashboard problem. The console reports at the shopper’s price, so the metric that matters is not ACOS alone but ACOS headroom against a break even built from your own wholesale price, cost of goods and coop. In our example, a blended 18.4% ACOS hid a campaign that lost $1,650, and a switch of revenue view moved TACoS from 6.5% to 9.9%.
Pick one revenue view and write it on the report, give every campaign a headroom number, reconcile the three ledgers monthly, and read results only after the 14 day window. Then use a tool that shows stock, price and ads together, so the question “why did sales drop” gets answered in minutes and not in a meeting.

FAQs
What PPC metrics should Vendor Central brands track?
Track ad spend, ad attributed sales, ACOS against your own break even ACOS, TACoS on a stated revenue view, new to brand share and stock cover on advertised ASINs. CTR, CVR and CPC help explain changes in those six.
Why does my ACOS look fine but I am not making money as a vendor?
The ad console shows sales at the shopper’s price, but a vendor earns the wholesale price less coop and allowances. In our illustrative example, break even ACOS is 23.5%, so a campaign at 29% loses money even when the blended account ACOS is 18.4%.
What is ACOS headroom?
ACOS headroom is break even ACOS minus actual ACOS, in percentage points. A positive figure means the campaign is profitable, and a figure below zero means it loses money, so report it by campaign instead of only in total.
How do I calculate TACoS on Vendor Central?
Divide ad spend by total sales and state which revenue view you used. In our example, $25,800 of spend gives a TACoS of 6.5% on $400,000 of ordered revenue and 9.9% on $260,000 of wholesale revenue.
Why do Vendor Central sales and ad console sales not match?
They measure different things on different schedules: shopper orders credited to ad clicks, retail sales and shipments, and the money Amazon pays after deductions. Reconcile them monthly and expect differences instead of forcing them to agree.
