

Table of Contents
Amazon advertising is changing – all the time. You would give me a resounding yes if you were around in 2015 when it all started.
Amazon Ads has come a long way from just auto-ads to 5 different ad types, placements, bid adjustments, bid modifiers, and so much more. It has become pretty hard to navigate Amazon advertising’s complex data, features, and functionalities.
Today, the challenges of Amazon ad optimization go beyond bid management and keyword targeting. They require structured Amazon PPC management that involves a detailed understanding of multiple variables and the subtle art of balancing spend with sales, often with the help of a Amazon PPC tool.
From choosing the right product SKU to adjusting negative keywords and exact match settings for keyword performance, advertising, and selecting the right campaign types, budgets, bids, and placements – Amazon sellers and agencies juggle a lot to get desired results.
But here is a catch. In the pursuit of fine-tuning details, brands and agencies get lost in the minute details, losing the broader picture.
Enter the concept of "Zooming Out".
Zooming out is a strategic approach that allows users to step back and look at data at a 10k-foot level. Let’s call it a holistic view of the advertising landscape. It enables sellers and agencies to assess their ad spends and performance from a macro perspective before delving into the specifics. It also helps identify overarching patterns that get masked while focusing on granularities.
Today, we will talk about simplifying metrics, zooming out before zooming in, and analyzing before optimizing. I promise this strategy will help you make informed decisions and get more successful outcomes.
Let me lay out the most important things that I would look at every week to find optimization opportunities:
Spend profile by products advertised
Spend profile by campaign type
Spend profile by placement type
Spend profile by keyword type
Spend profile by search term type
Understanding Spend Profile by Product and Product Band
I always say that when it comes to digital/performance advertising, the “WHAT” is always more important than the “HOW.”
What are you advertising?
Are you advertising a high-performing or high-converting product or a low-performing one?
Driving traffic to already high-converting products with strong buy box ownership and plenty of positive reviews will amplify your organic sales growth. On the contrary, driving traffic to low-converting products will simply be a money sink.
This is where the concept of Product Bands comes in. Simply put, it is an extension of the 80-20 rule. The 80-20 rule states that 80% of your sales come from 20% of your products.
However, relying on the 80-20 rule is complicated for Amazon advertising. An Amazon seller account with hundreds of products/SKUs, a.k.a ASINs (Amazon Standard Identification Number), advertises different products for various reasons: new launches, inventory liquidation, increasing sales, etc. Hence, breaking down the 80-20 rule into the 50-30-20 rule is better. This concept offers a structured approach to categorizing and analyzing your ad spend profile.
Suppose there are 3 Product Bands – Band A, Band B, and Band C. The bands are defined based on the sales performance of each ASIN product.
Product Band A represents the top echelon, including ASINs that drive the top 50% of your sales. These are your bestsellers. The products that consistently perform well and are often the primary drivers of your revenue.
Product Band B includes ASINs contributing to the middle 30% of your sales. These products are significant but don’t match the stellar performance of Band A.
Product Band C consists of the bottom 20% of ASINs in terms of sales. While these products are the lowest performers in terms of sales volume, they can be important for portfolio diversity or targeting niche markets.
Categorizing ASINs into these bands has several advantages:
Prioritization and Budget Allocation
No points for guessing that Products in Band A should be allocated the highest budget. Since Band A products are your bestsellers, with established conversion rates and high sales volume, allocate 50% of your Amazon ad budget to them. Next, you should prioritize Band B and Band C and allocate 30% and 20% of your budget, respectively. This strategic approach ensures investing heavily in top-performing products while maintaining a balanced portfolio.
Strategy Building
High-performing ASINs in Band A will have a different advertising strategy compared to those in Bands B and C. Band A ASINs should focus on domination and visibility and Band B ASINs might need a targeted ad boost to elevate their performance. Band C ASINs might need a conservative spend, focusing ONLY on niche targeting or even re-evaluating their market viability (i.e., no ads and product discontinuation in simple language).
Impact Measurement Metrics
Advertising each product band calls for different ways of impact measurement. For Band A, analyze the Return On Ad Spend (ROAS) to ensure that the high investment is justifiable by equally high returns. In Band B, experiment with different Amazon ad types or marketing messages to see what resonates with the target audience and has the potential to elevate these products. For Band C, the focus should be on cost-effective strategies, leveraging long-tail keywords or exploring cross-selling opportunities with higher-ranking products.
So, now that we know it is important, how can you identify KPIs? There are two ways:
Data Aggregation
In this method, you can aggregate data from Amazon Seller Central and advertising to define spend by Product Band. If you already know your top sellers, you can also look at your total sales and define this number.
Step 1: Go to Seller Central > Business reports and download for the given week. If you are on Vendor Central, you can get this data from Report Analytics > Sales.
Step 2: Divide product data into 3 Bands: Top Selling ASINs, Medium Selling ASINs, and Bottom Selling ASINs. You can define top-selling ASINs as the top 50% of ASINs by sales or a higher number. You can define the metrics when manually doing the entire operation.
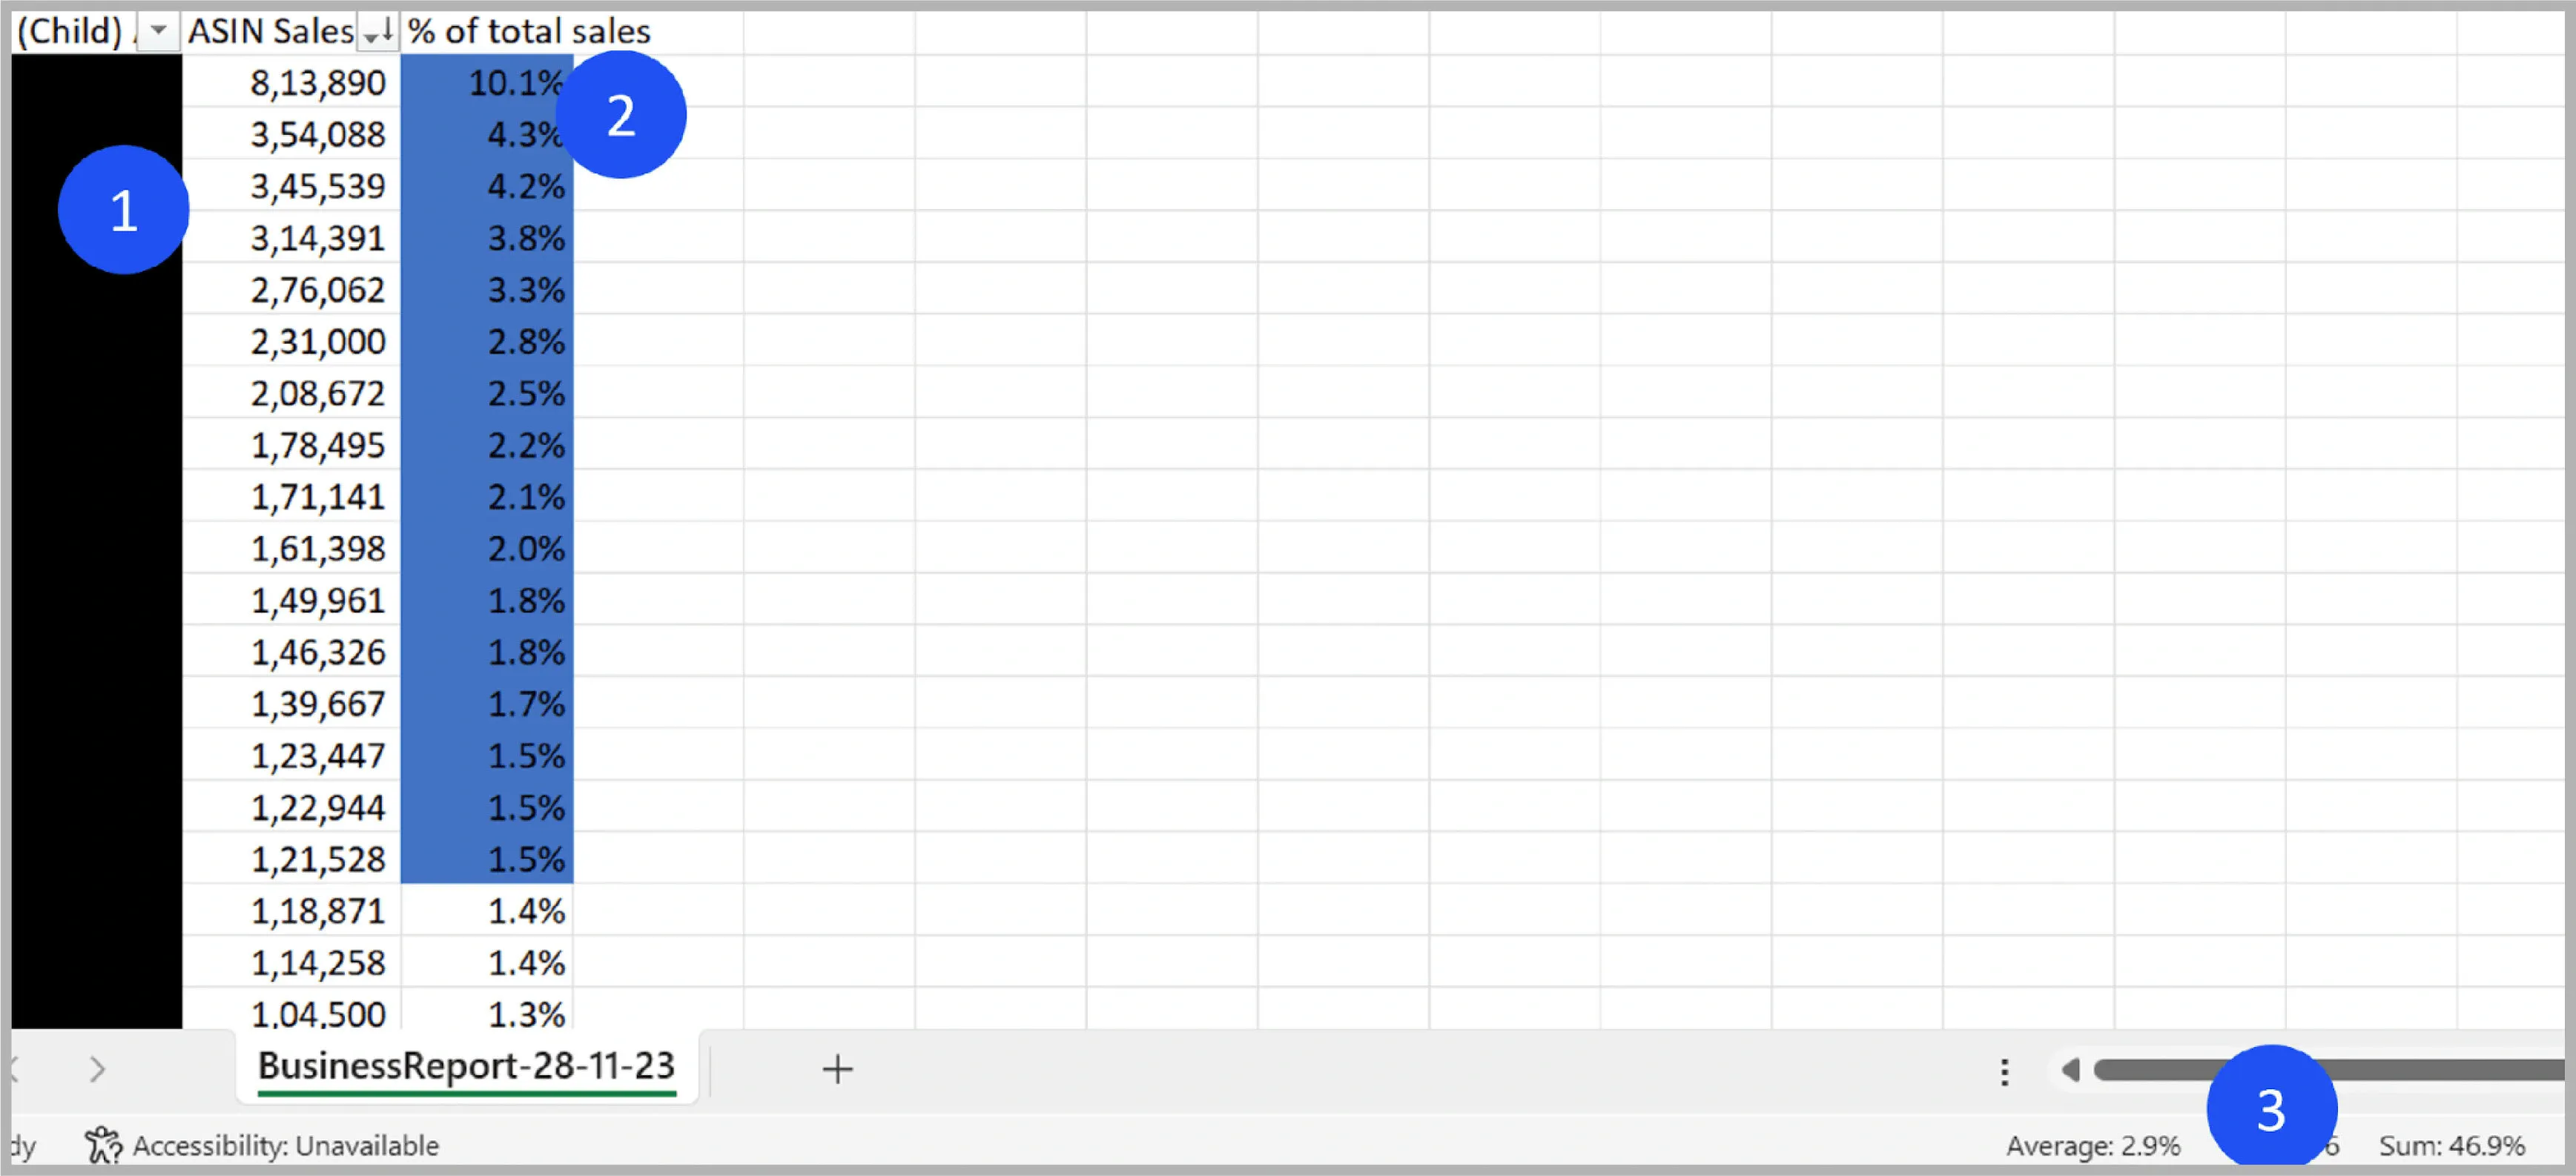
Step 3: Go to the Advertising console. Download Product Dashboard data.

Step 4: Combine the spends and sales in one spreadsheet.
Step 5: Add the percentage spent on each ASIN. Compare % Spend on Band A, Band B, and Band C.
Well, it's not voila! And it takes a lot of time, but you got the job done!
Ready-To-Use Dashboards
With atom11, an Amazon ad optimization software and PPC tool, you can get an ad spend profile by band type.
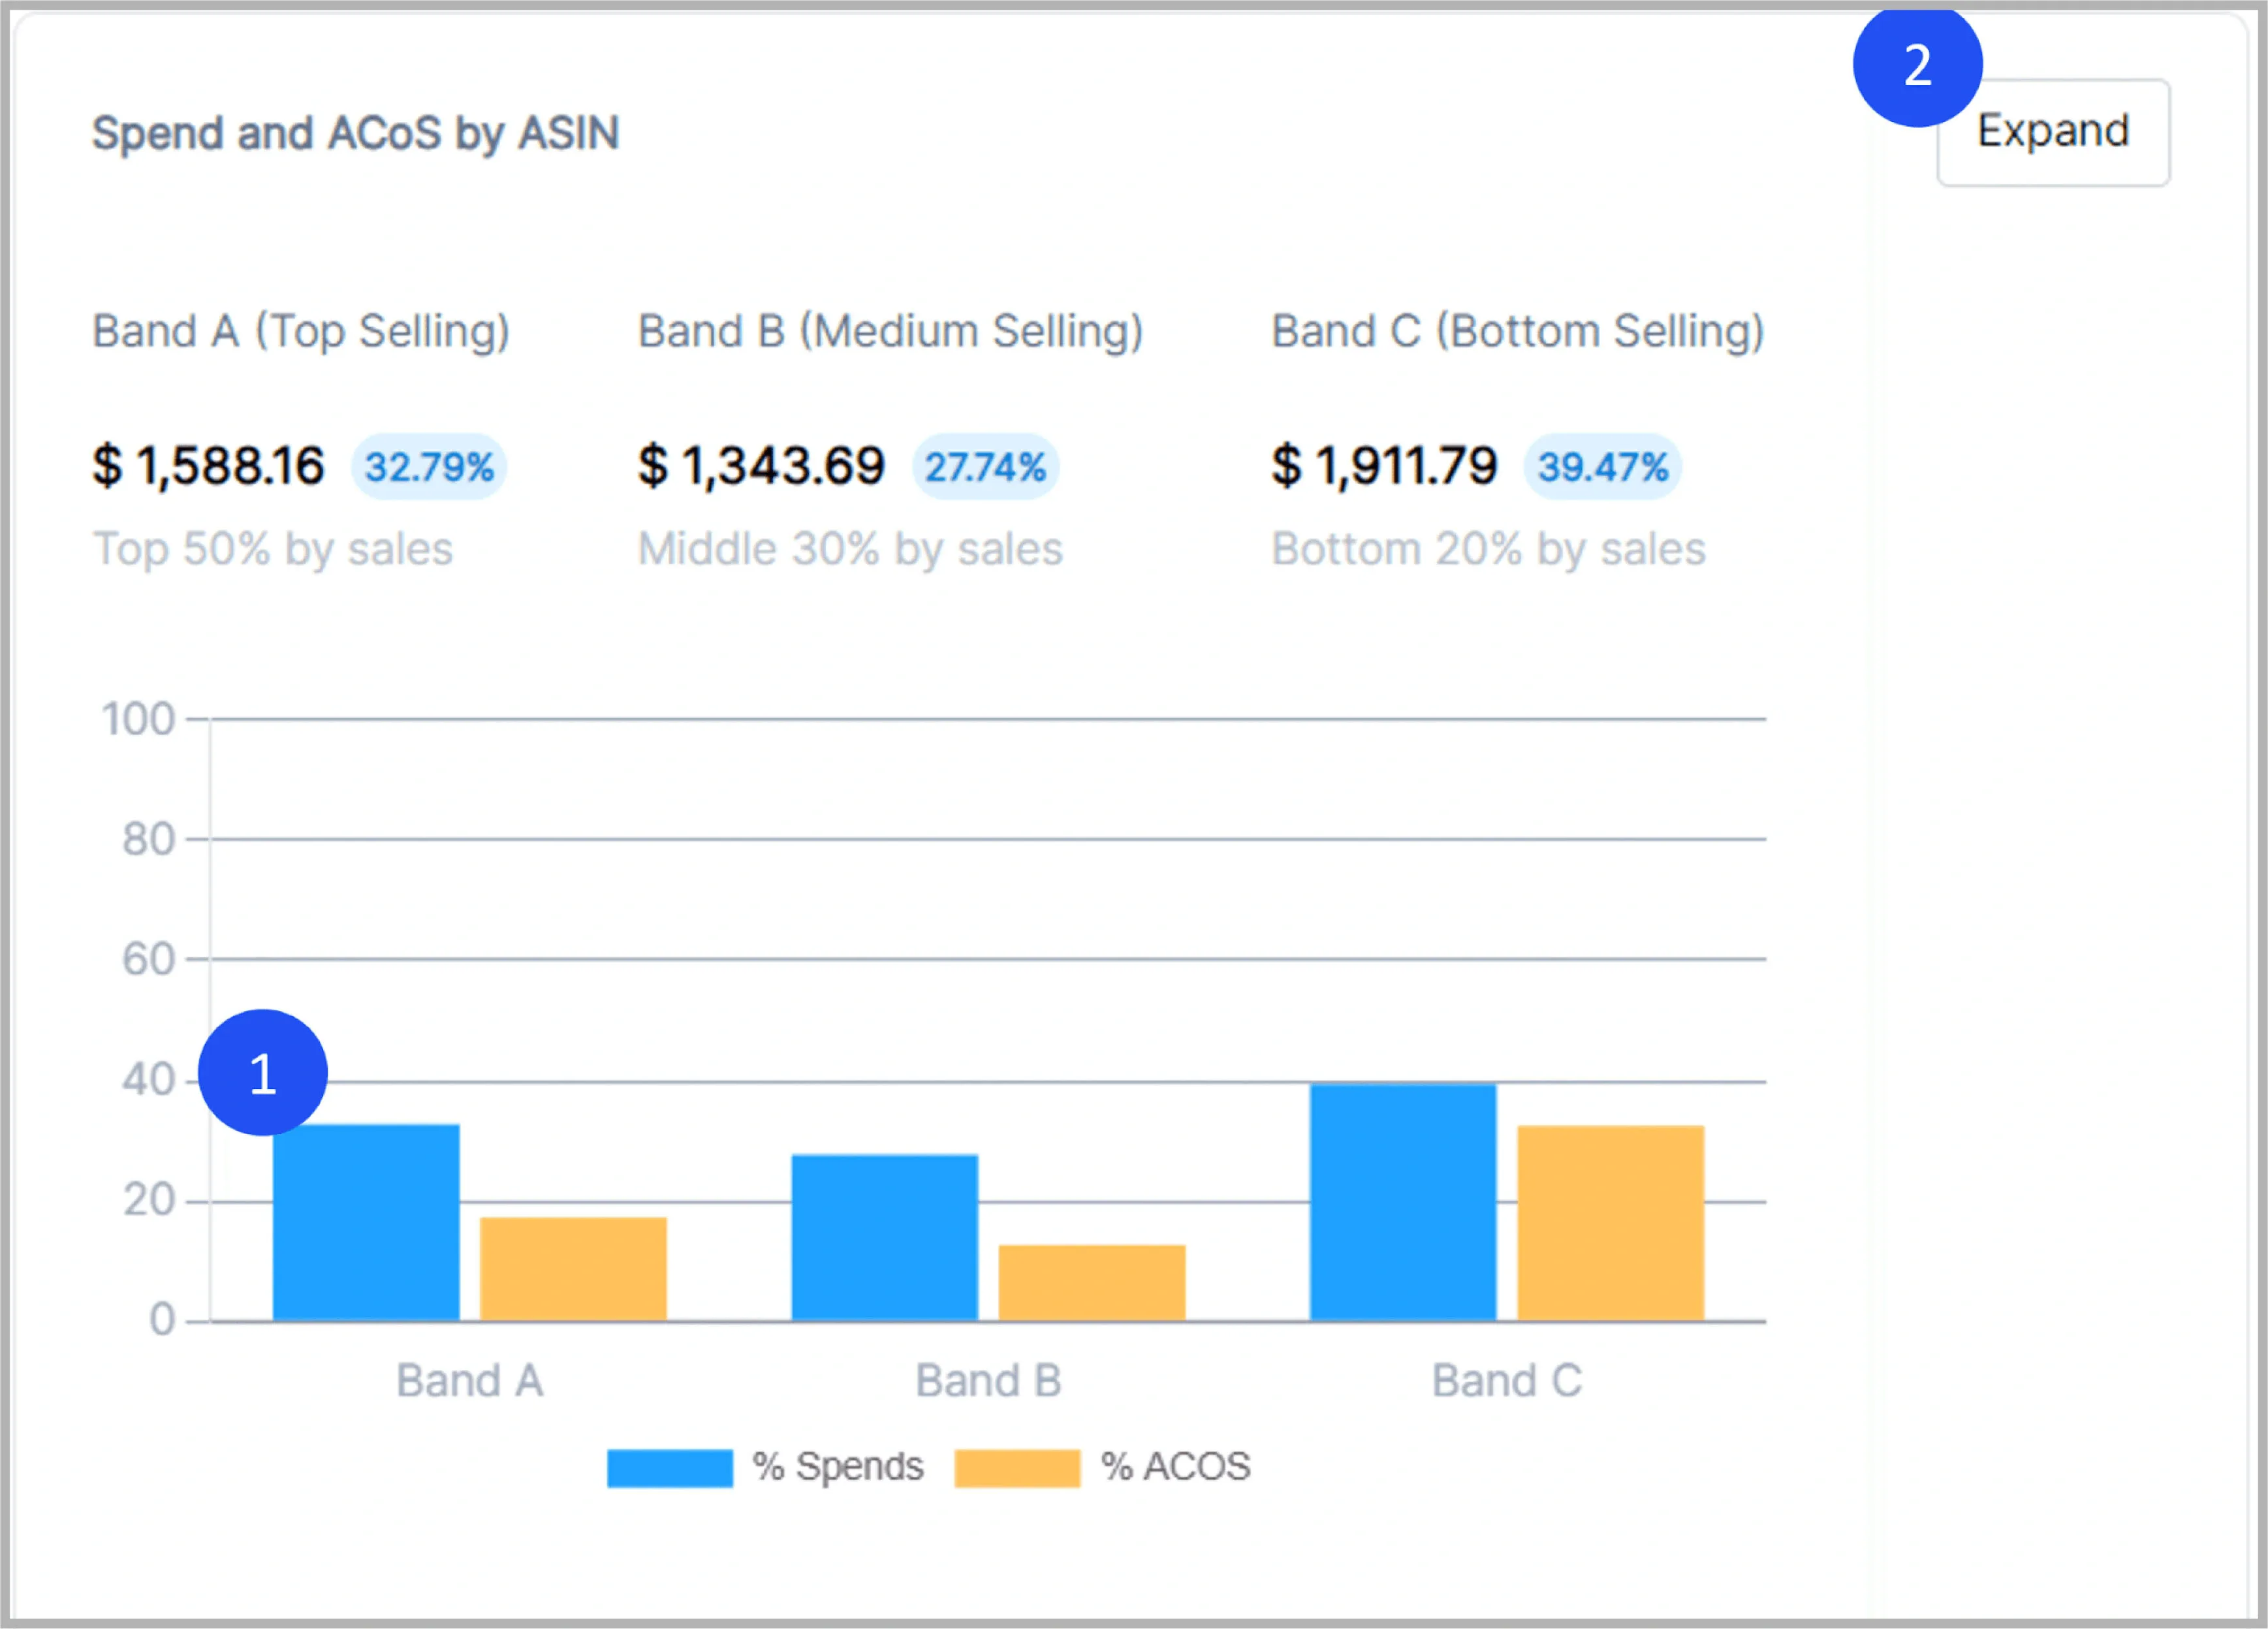
You will know your spend by Product Band.
By clicking the expand button, you will learn the performance of each product band.
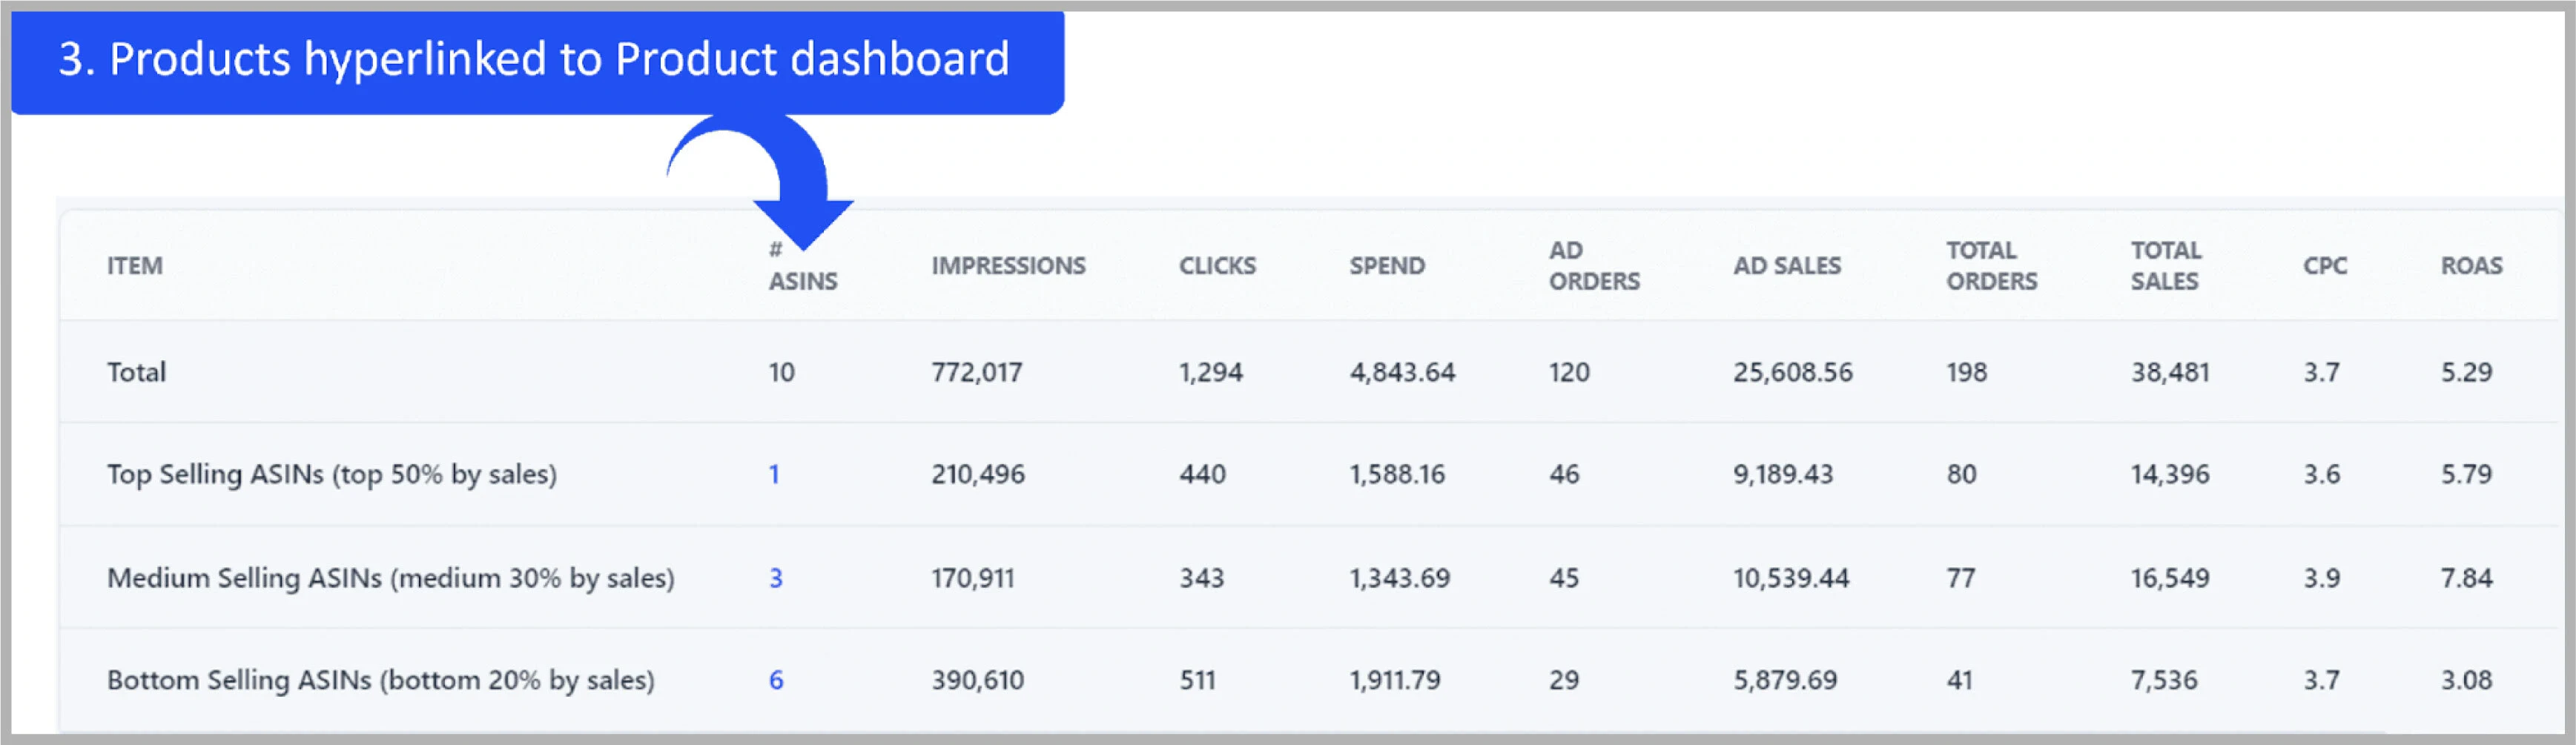
Within the expanded table, you will know which products are included in each band during that period.
Understanding your Spend Profile by Product and Product Band is not just about allocating a budget; it's about strategically investing in your products based on market performance and potential. This approach leads to more informed decisions, ensuring that each dollar spent on advertising contributes effectively to your overall business goals on Amazon.
Understanding Spend Profile by Campaign Type
Sellers are often caught up in the dilemma of choosing between auto campaigns and manual targeting. Sellers are often caught up in the dilemma of choosing between auto campaigns and manual targeting. The main difference is that auto campaigns are great for search engine optimization and negative targeting, while manual campaigns provide more control over specific keywords and daily budget allocation.
Before you make a choice, here are the three types of Amazon campaigns: Sponsored Products (SP), Sponsored Brands (SB), and Sponsored Display (SD), each serving unique objectives and targeting different aspects of the buyer's journey.
Sponsored Products (SP)
This type of Amazon advertising campaign is particularly effective for driving sales and improving organic rankings for specific product listings. It is best suited for increasing the visibility of individual products. A high focus on sponsored product ad campaigns reveals a higher focus on ROAS metric for advertising.
Sponsored Brands (SB)
This campaign type, formerly known as Headline Search Ads, is designed to enhance brand recognition, and involve tracking metrics like number of clicks and impressions. SB campaigns are ideal for sellers with a range of products and those looking to boost brand awareness.
Sponsored Display (SD)
Sponsored Display ads focus on reaching customers on and off Amazon with auto-generated, display-like ads. These display campaigns use Amazon's shopper data to retarget customers who viewed your products or similar ones. SD campaigns are crucial for reinforcing brand recall and nudging customers who might be considering a purchase.
Allocating a budget across these campaign types is not a one-size-fits-all approach and should be aligned with your business goals. For example, high ROAS focus brands should spend 60-70% of their budget on SP. For sellers trying to build a brand, at least 30% of the spend should go to SB. Further, a new product might benefit more from SB for brand awareness, while an established product might need more SP campaigns to stay competitive in search results.
| Related read: Amazon DSP vs Sponsored Display Ads: All You Need To Know
Now, let’s look into the two ways to identify the KPIs.
Data Aggregation
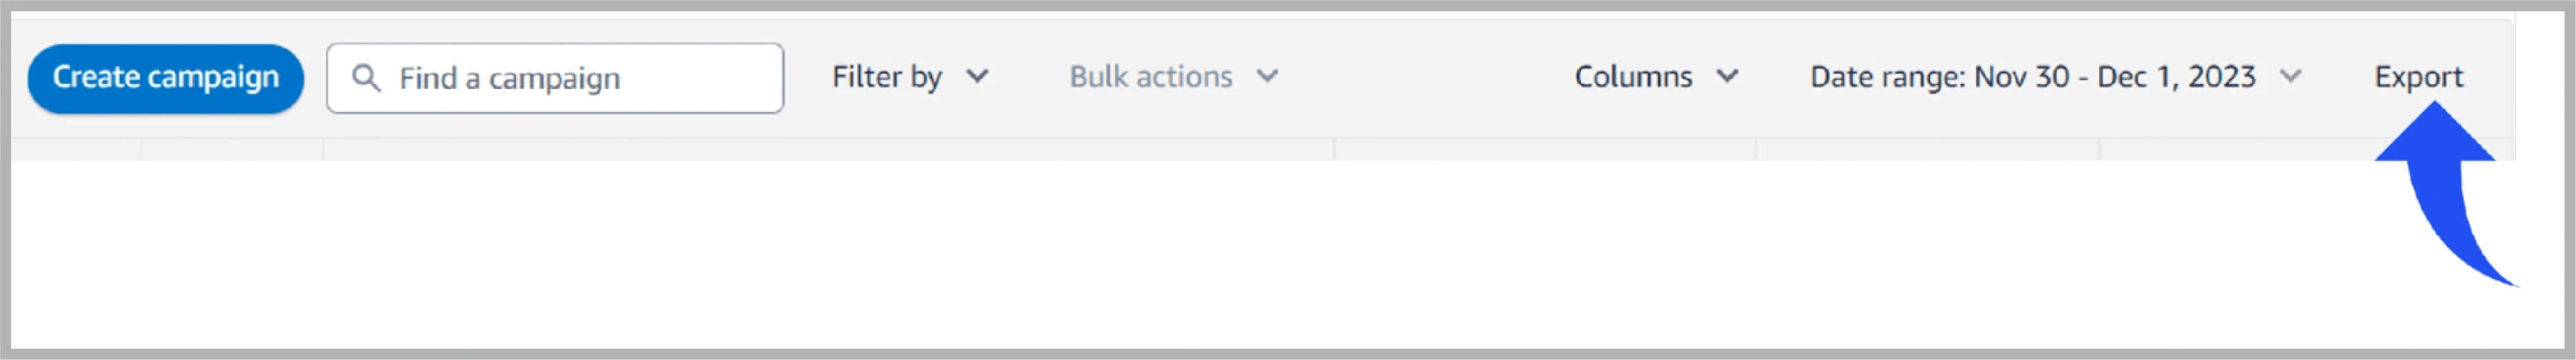
Step 1: Export campaign manager data for a given date range
Step 2: Create a pivot on campaign type and measure spends and ROAS. Add ad spend percentage to find spend percentage across campaign types.
Ready-To-Use Dashboards
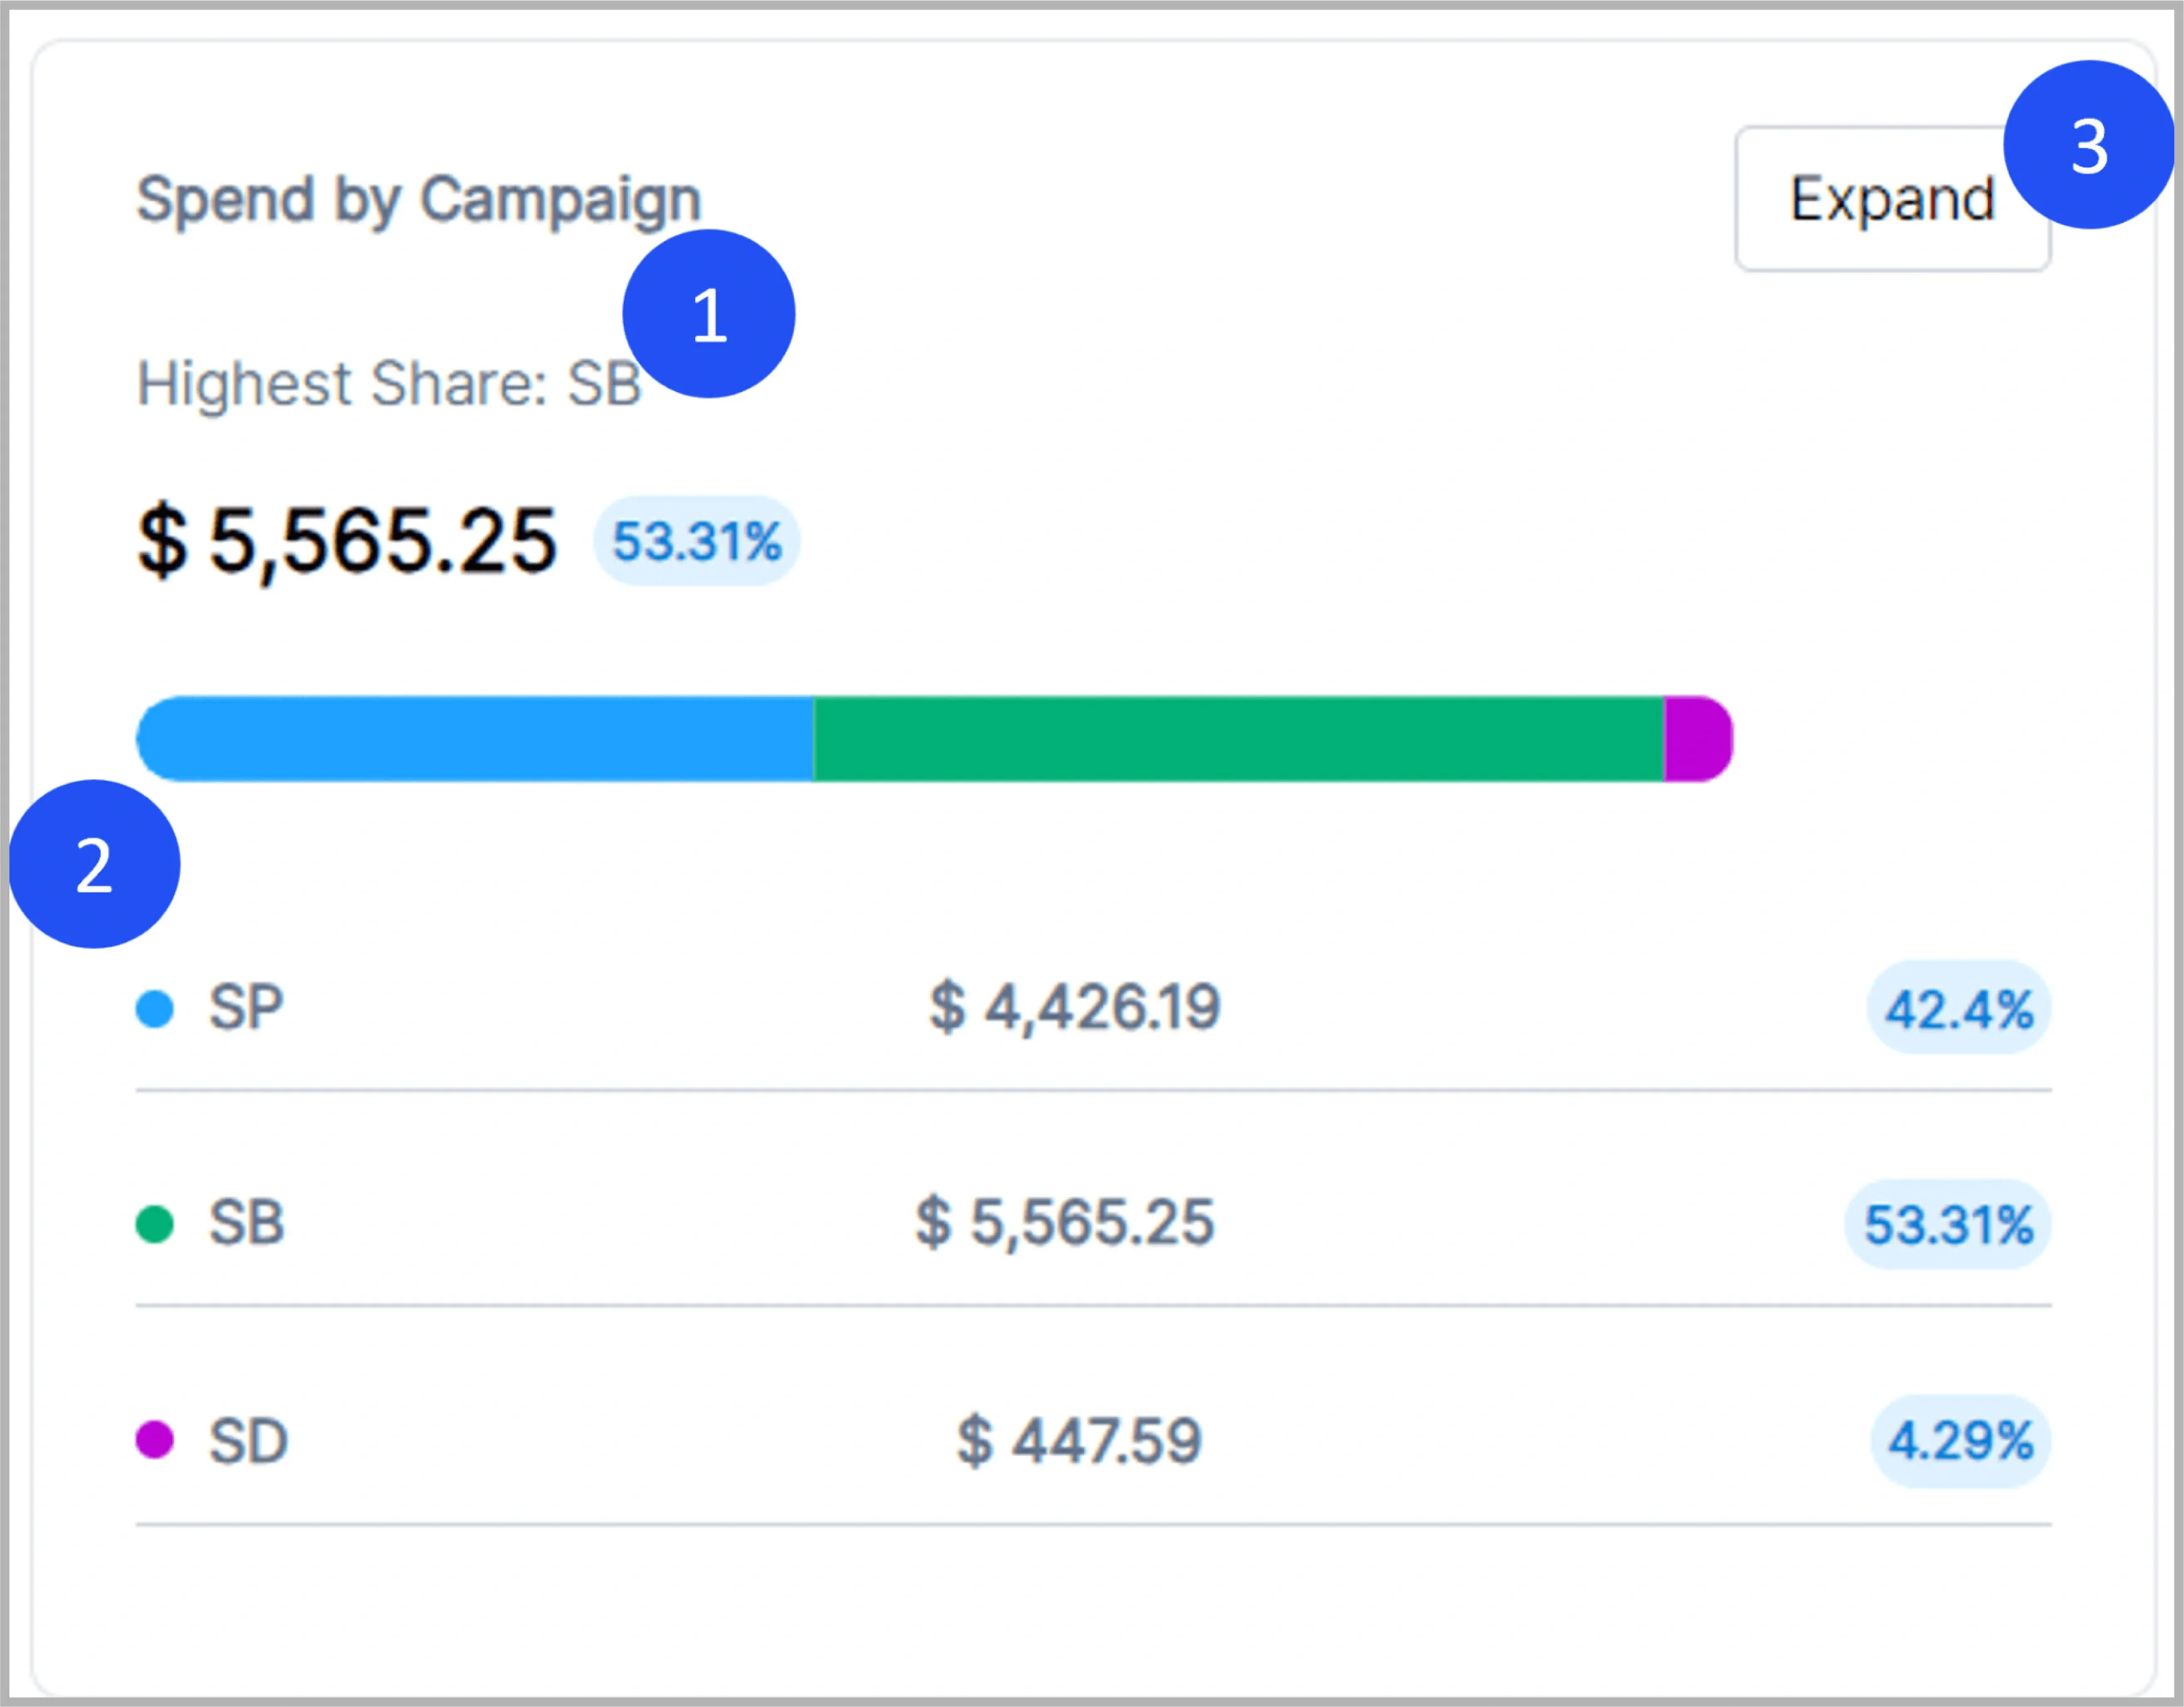
Using atom11, you can easily access information on campaign spend profiles.
Right off the bat, you will know which campaign type is dominant (in terms of spend) for your account.
You will know your spend by Campaign Type.
By clicking the expand button, you will learn the performance of each campaign type.
Effective budget allocation requires continuous testing and data analysis. Regularly reviewing ad campaign performance, experimenting with different ad creatives, A/B testing ads, trying new keywords and targeting strategies, and adjusting budgets based on campaign performance trends are essential techniques.
Additionally, using tools like Amazon’s Campaign Manager and considering historical sales data can provide insights into how best to distribute your advertising budget across these campaign types, ensuring each dollar spent is an investment toward achieving your business objectives on Amazon.
Understanding Spend Profile by Placement Type
Ad placement (only for SP ads) is critical in ad effectiveness and overall performance. Amazon offers different ad placement options. Each placement has its own advantages and limitations. Understanding these placements – primarily top of search, bottom of search, and product detail pages – is key to crafting a spend profile that maximizes visibility and conversion.
Top of Search
Top of Search placements are arguably the most coveted. They appear at the top of the page when a customer types a search query on Amazon.
Top of search placement is highly competitive due to its high visibility and the propensity to attract clicks from customers early in their buying journey. Products featured here get higher click-through rates, conversions, and sales.
Rest of Search
Rest of Search placements appear at the end of the search results. While these spots receive less visibility than top placements, they capture the attention of customers who scroll through multiple listings, indicating a deeper level of engagement or a more considered purchase decision. Ads in these placements can be effective for products that require more thoughtful consideration or for capturing sales from determined buyers who haven’t yet found what they’re looking for.
Product Detail Page
Product Detail Page placements show ads on the product detail pages of similar or complementary products. This placement is effective for cross-selling and upselling, as it targets customers already in a purchasing mindset. Detail product page placements can also divert a customer’s attention from a competitor’s product to yours, offering a strategic advantage in competitive categories.
How to Evaluate Performance by Placement?
Here are the two ways to identify KPIs:
Data Aggregation
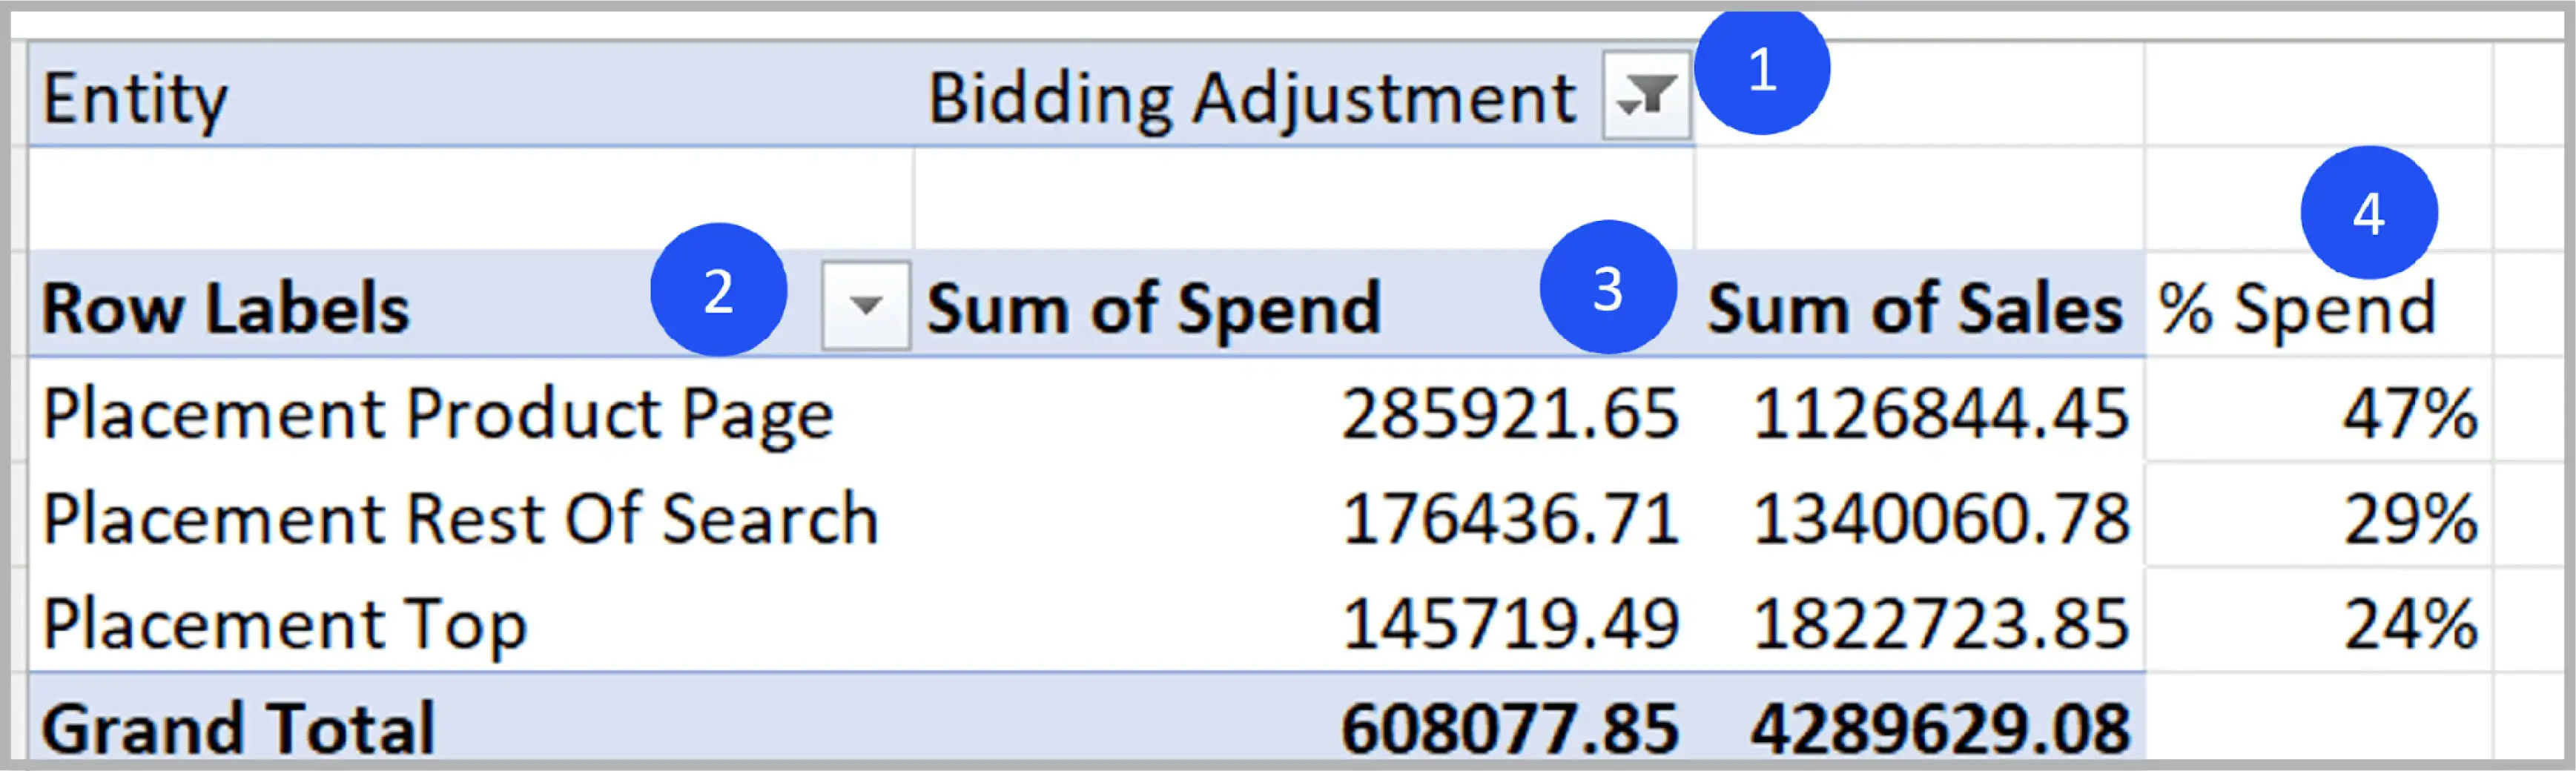
Step 1: Download the bulk sheet for the given time range.
Step 2: On the Sponsored Product tab, use all data to create a pivot placement to see placement-wise data.
Step 3: Create a pivot on placement type and measure ad spend and ad spend percentage by placement.
Ready-To-Use Dashboards
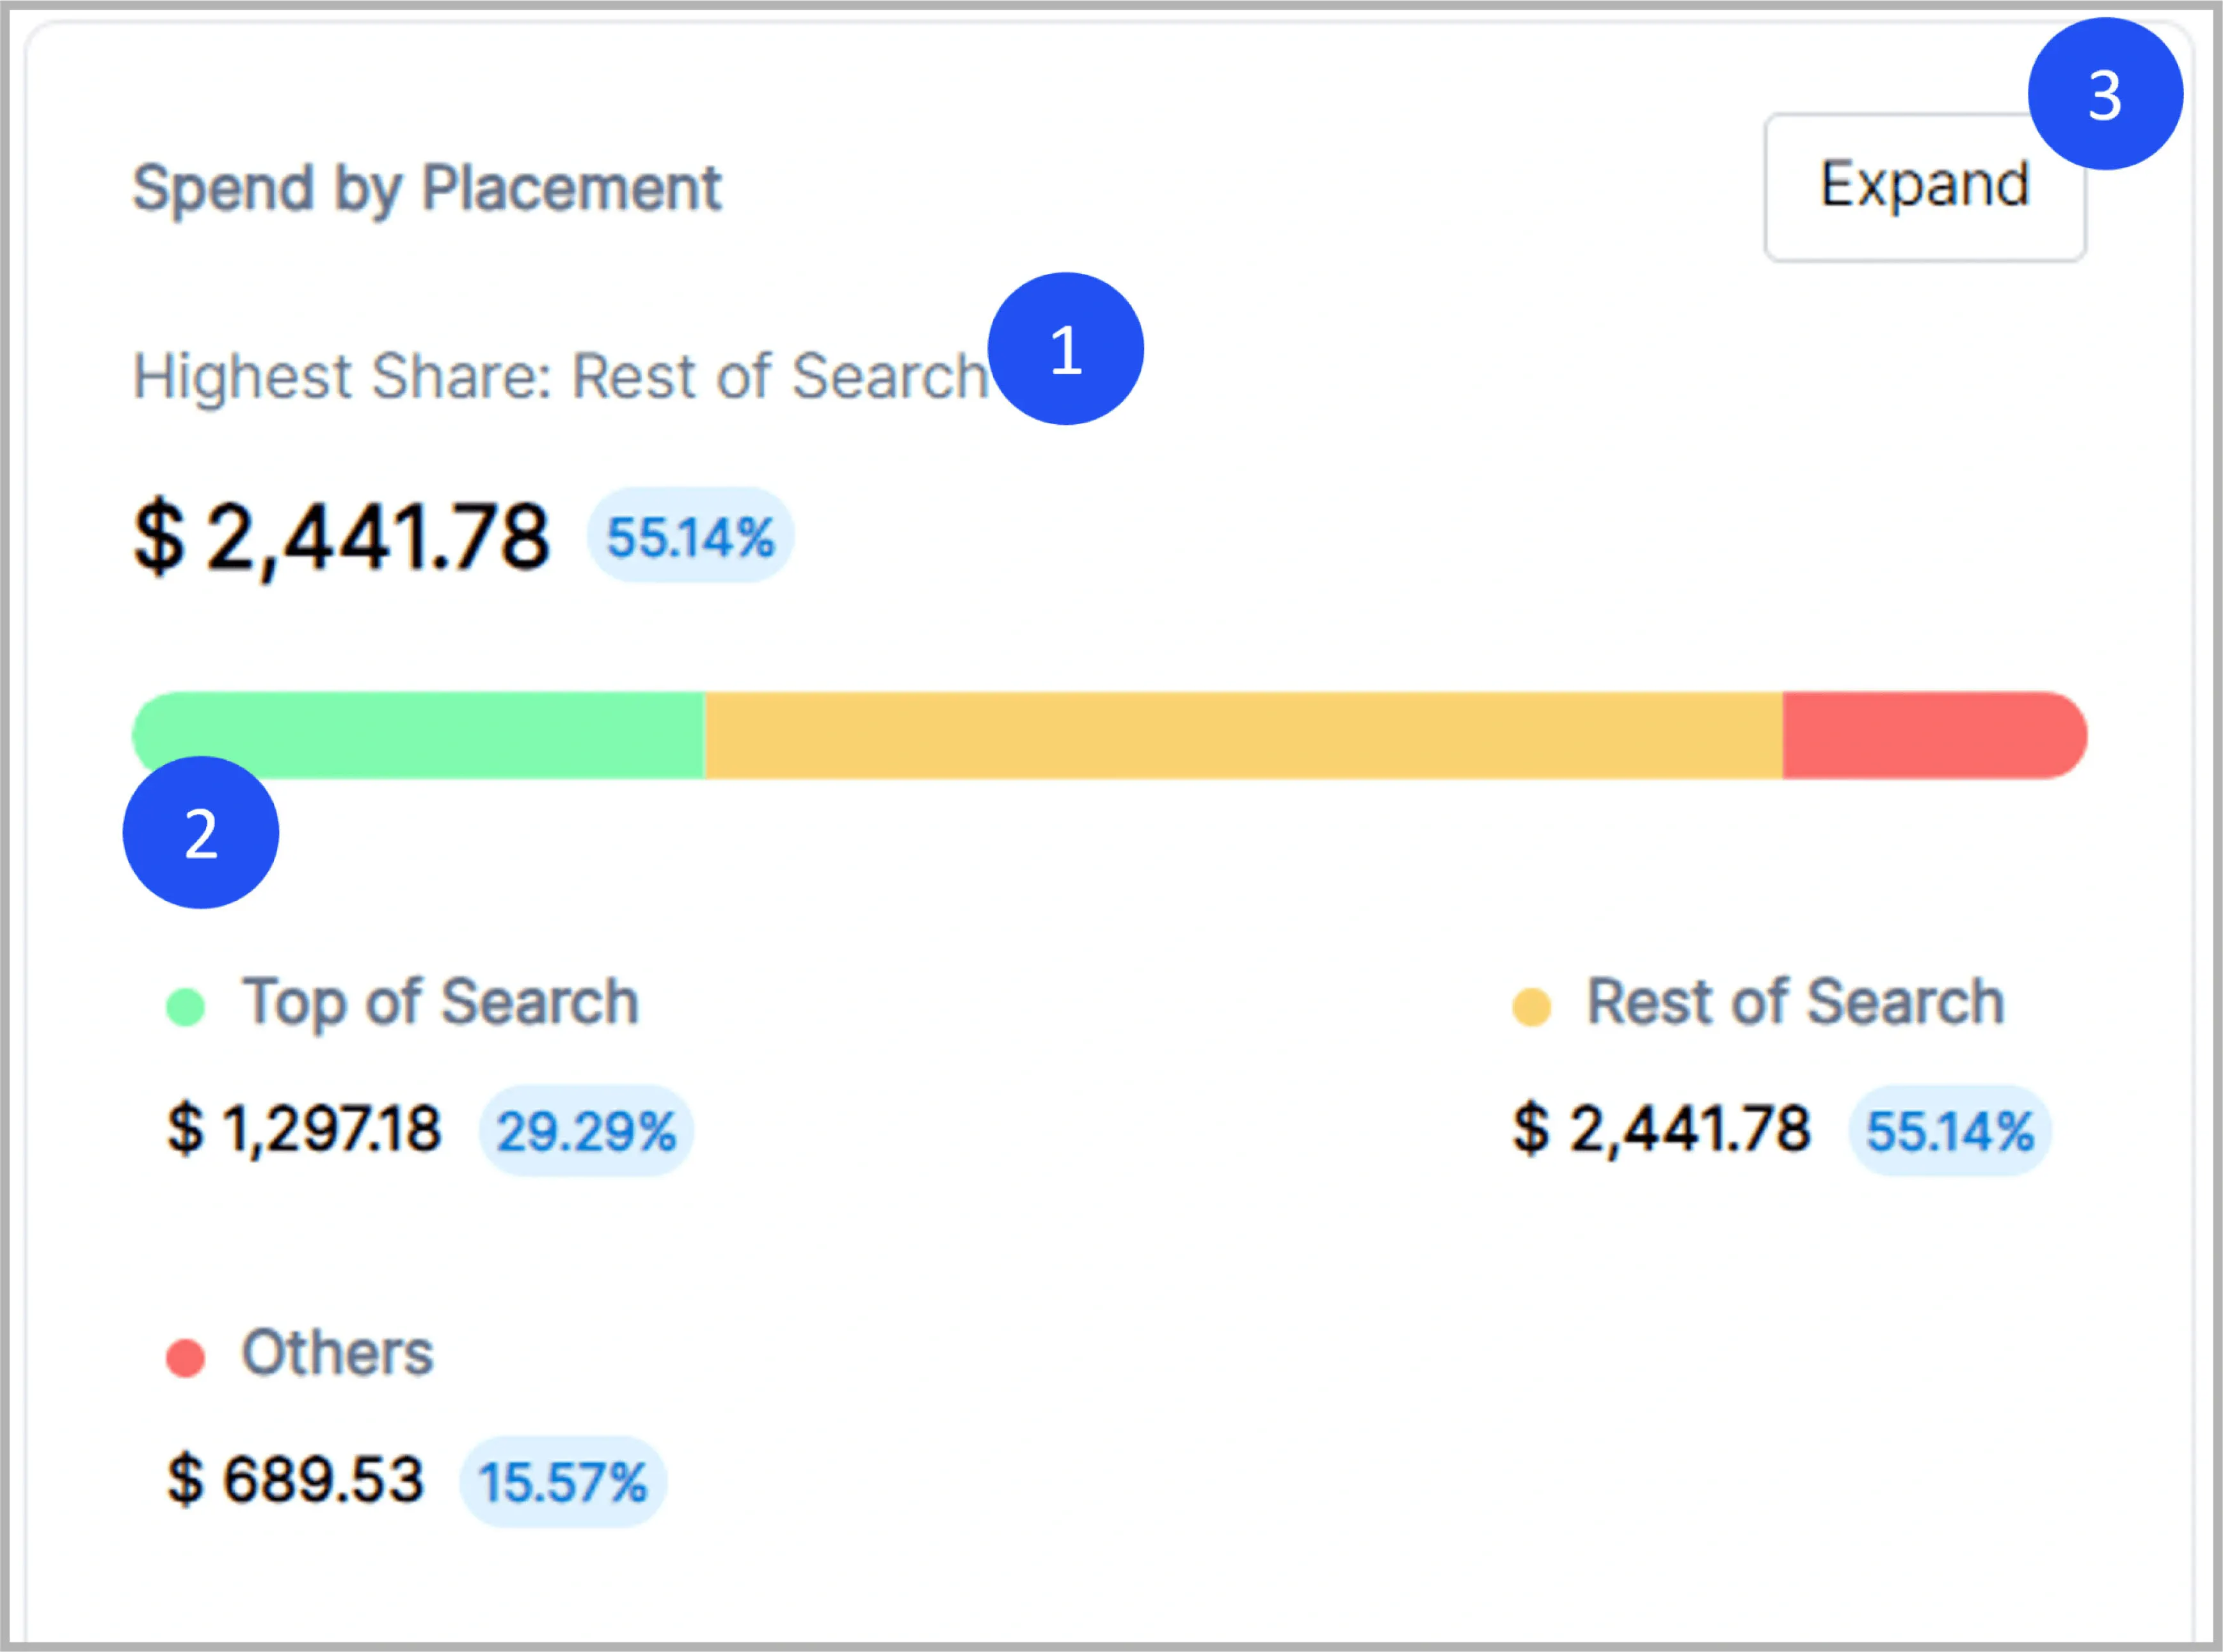
atom11 provides you with a ready-to-use placement spend profile. For example,
Right off the bat, you will know which placement is dominant (in terms of spends) on your account.
You will know your spend by Placement type.
By clicking the expand button, you will learn the performance of each placement type.
In summary, a nuanced understanding and strategic application of different ad placements on Amazon can help you get better results from your advertising efforts. By analyzing each placement’s performance and adapting your strategy accordingly, you can optimize your ad spend for better visibility and higher conversion rates.
Understanding Spend Profile by Search Terms
After peeling all the layers, we come to the crux of all Spend Profiles. Spend Distribution by type of search terms. Search terms can be broadly categorized into branded, competitor, and generic. Let’s dive into it.
Branded Search Terms
Branded search terms refer to keywords that include a brand name. For example, “Sony headphones” or “Adidas running shoes.” These terms are highly targeted and often yield high conversion rates as they attract customers already familiar with and interested in your brand.
The primary strategy for branded search terms is to defend brand territory and capture high-intent buyers.
It is essential to watch out for your spend distribution on branded search terms. Overspending (a common issue) means you are not focusing on new customers; and underspending means you are not defending your turf.
Competitor Search Terms
These search terms involve using competitors’ brand names in your keywords. For instance, a small electronic company might use “Bose speakers” as a search term to attract customers looking for similar products. The strategy here is to capture traffic from competitors, which can be effective but often comes with higher costs and lower conversion rates than branded search terms.
Generic Search Terms
The generic search terms are broad and do not include brand names, such as “wireless headphones” or “running shoes.” These terms are essential for reaching a wider audience, especially those who are not brand-conscious or are in the early stages of the buying process. While generic terms can drive a significant traffic volume, they often have lower conversion rates and higher competition, resulting in higher advertising costs.
Typical Spend Profile by Search Terms
Spend profile by type of search term depends on two things:
Brand’s Sub-Category
Each sub-category is different. For example, skincare and electronics (phones/ laptops) rely a lot on branded search terms, and hence, brands in this sub-category should focus more on branded and competition search terms rather than generic search terms.
On the other hand, commodity subcategories like floor cleaners or headphones are more generic. It is wise to measure your spend profile accordingly.
Brand Size
Larger brands with established recognition might benefit more from focusing on branded and competitor terms to defend their market position and capture traffic from rivals. Smaller or emerging brands, however, might find more value in allocating a significant portion of their budget towards generic terms to build brand awareness and customer base.
How to measure your search term spend distribution?
There are two ways to identify KPIs that measure search term spend distribution.
Data Aggregation
Step 1: Download the search term report for SP and SB.
Step 2: Divide product data into three parts: Branded, Competition, and Generic.
Step 3: Create Pivot on Search term type and measure percentage spend.
Ready-To-Use Dashboards
atom11 makes measuring ad spend with keyword spend profile easier.
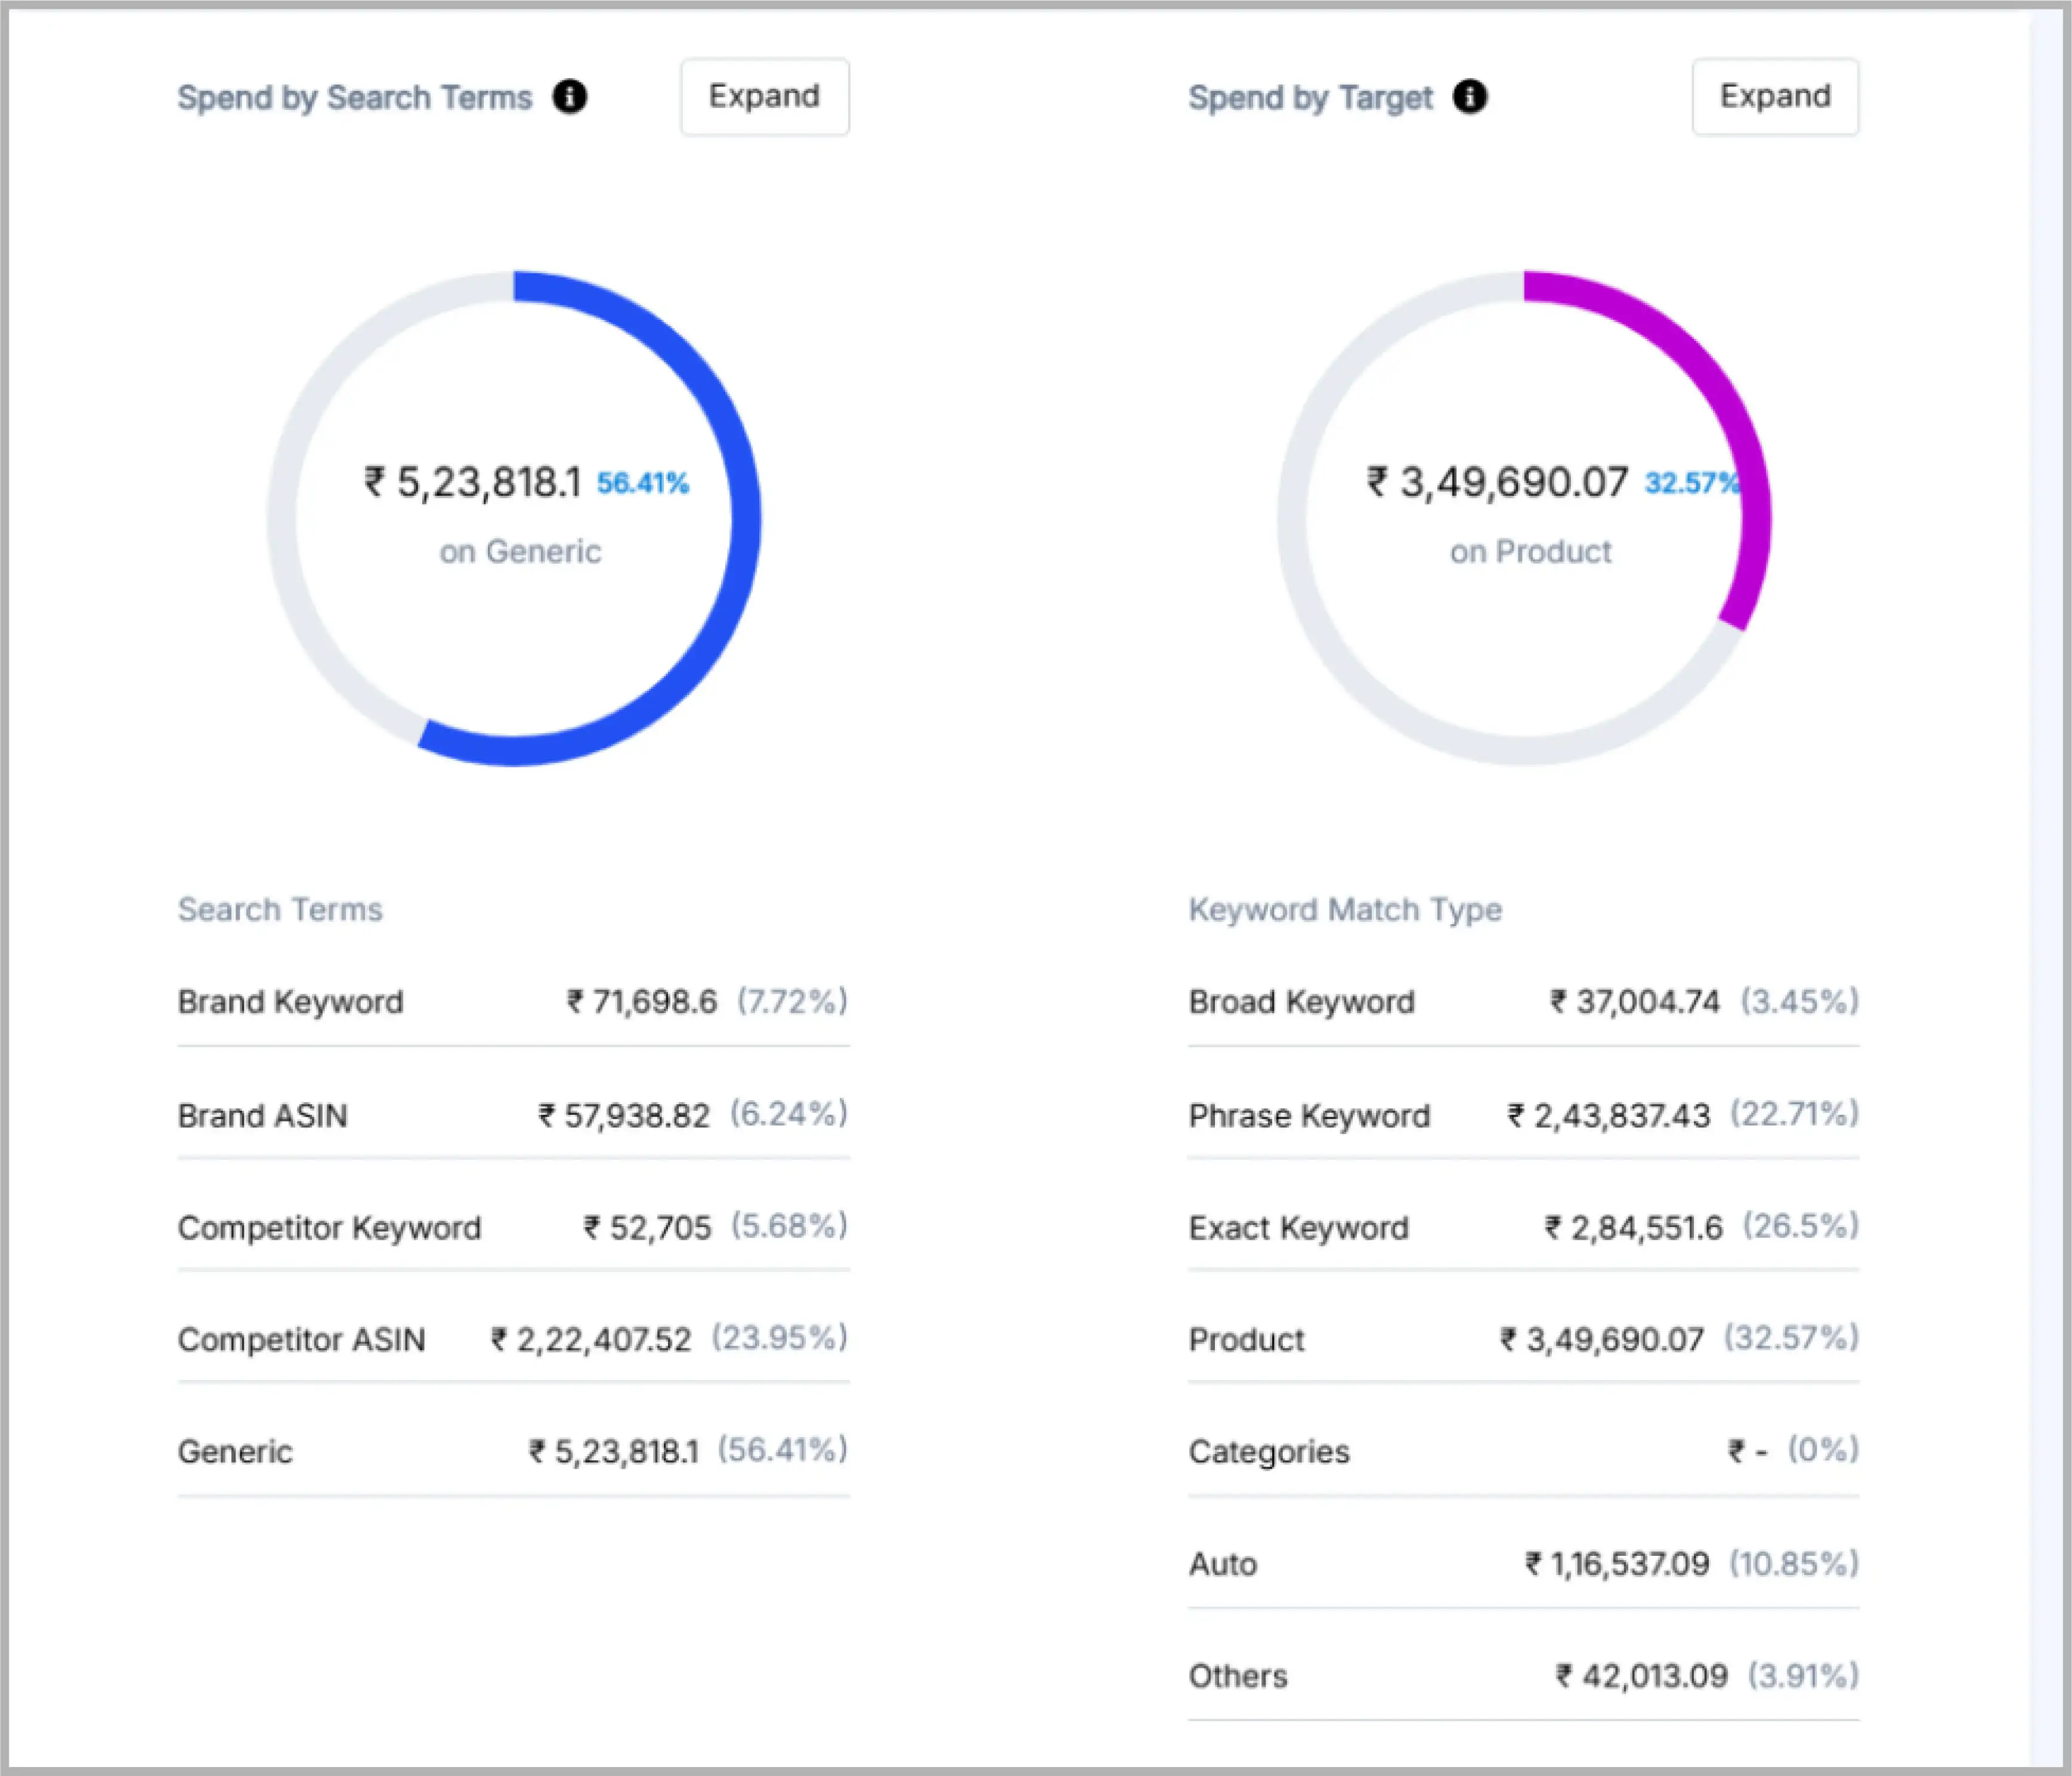
You will know which search term and keyword type is dominant (in terms of spends) right away on your account.
You will know your spend by different search term types and keyword types.
By clicking the expand button, you can learn about the performance of each search term and keyword type.
💡Tip: Cap branded spends to 30% for large brands and <10% for smaller brands because larger brands have high brand recognition and loyal customers actively search for their products by brand name. Whereas smaller brands must spend more on generic terms to increase brand awareness.
To summarize, creating an Amazon spend profile by search term type involves a nuanced approach that considers the strengths and limitations of branded, competitor, and generic terms. By strategically allocating budget, dynamically adjusting bids, and continually analyzing performance data, sellers can optimize their ad spend for maximum ROI and effectively reach their target audience.
Below is the ad spend portfolio graph that atom11 provides to its users.
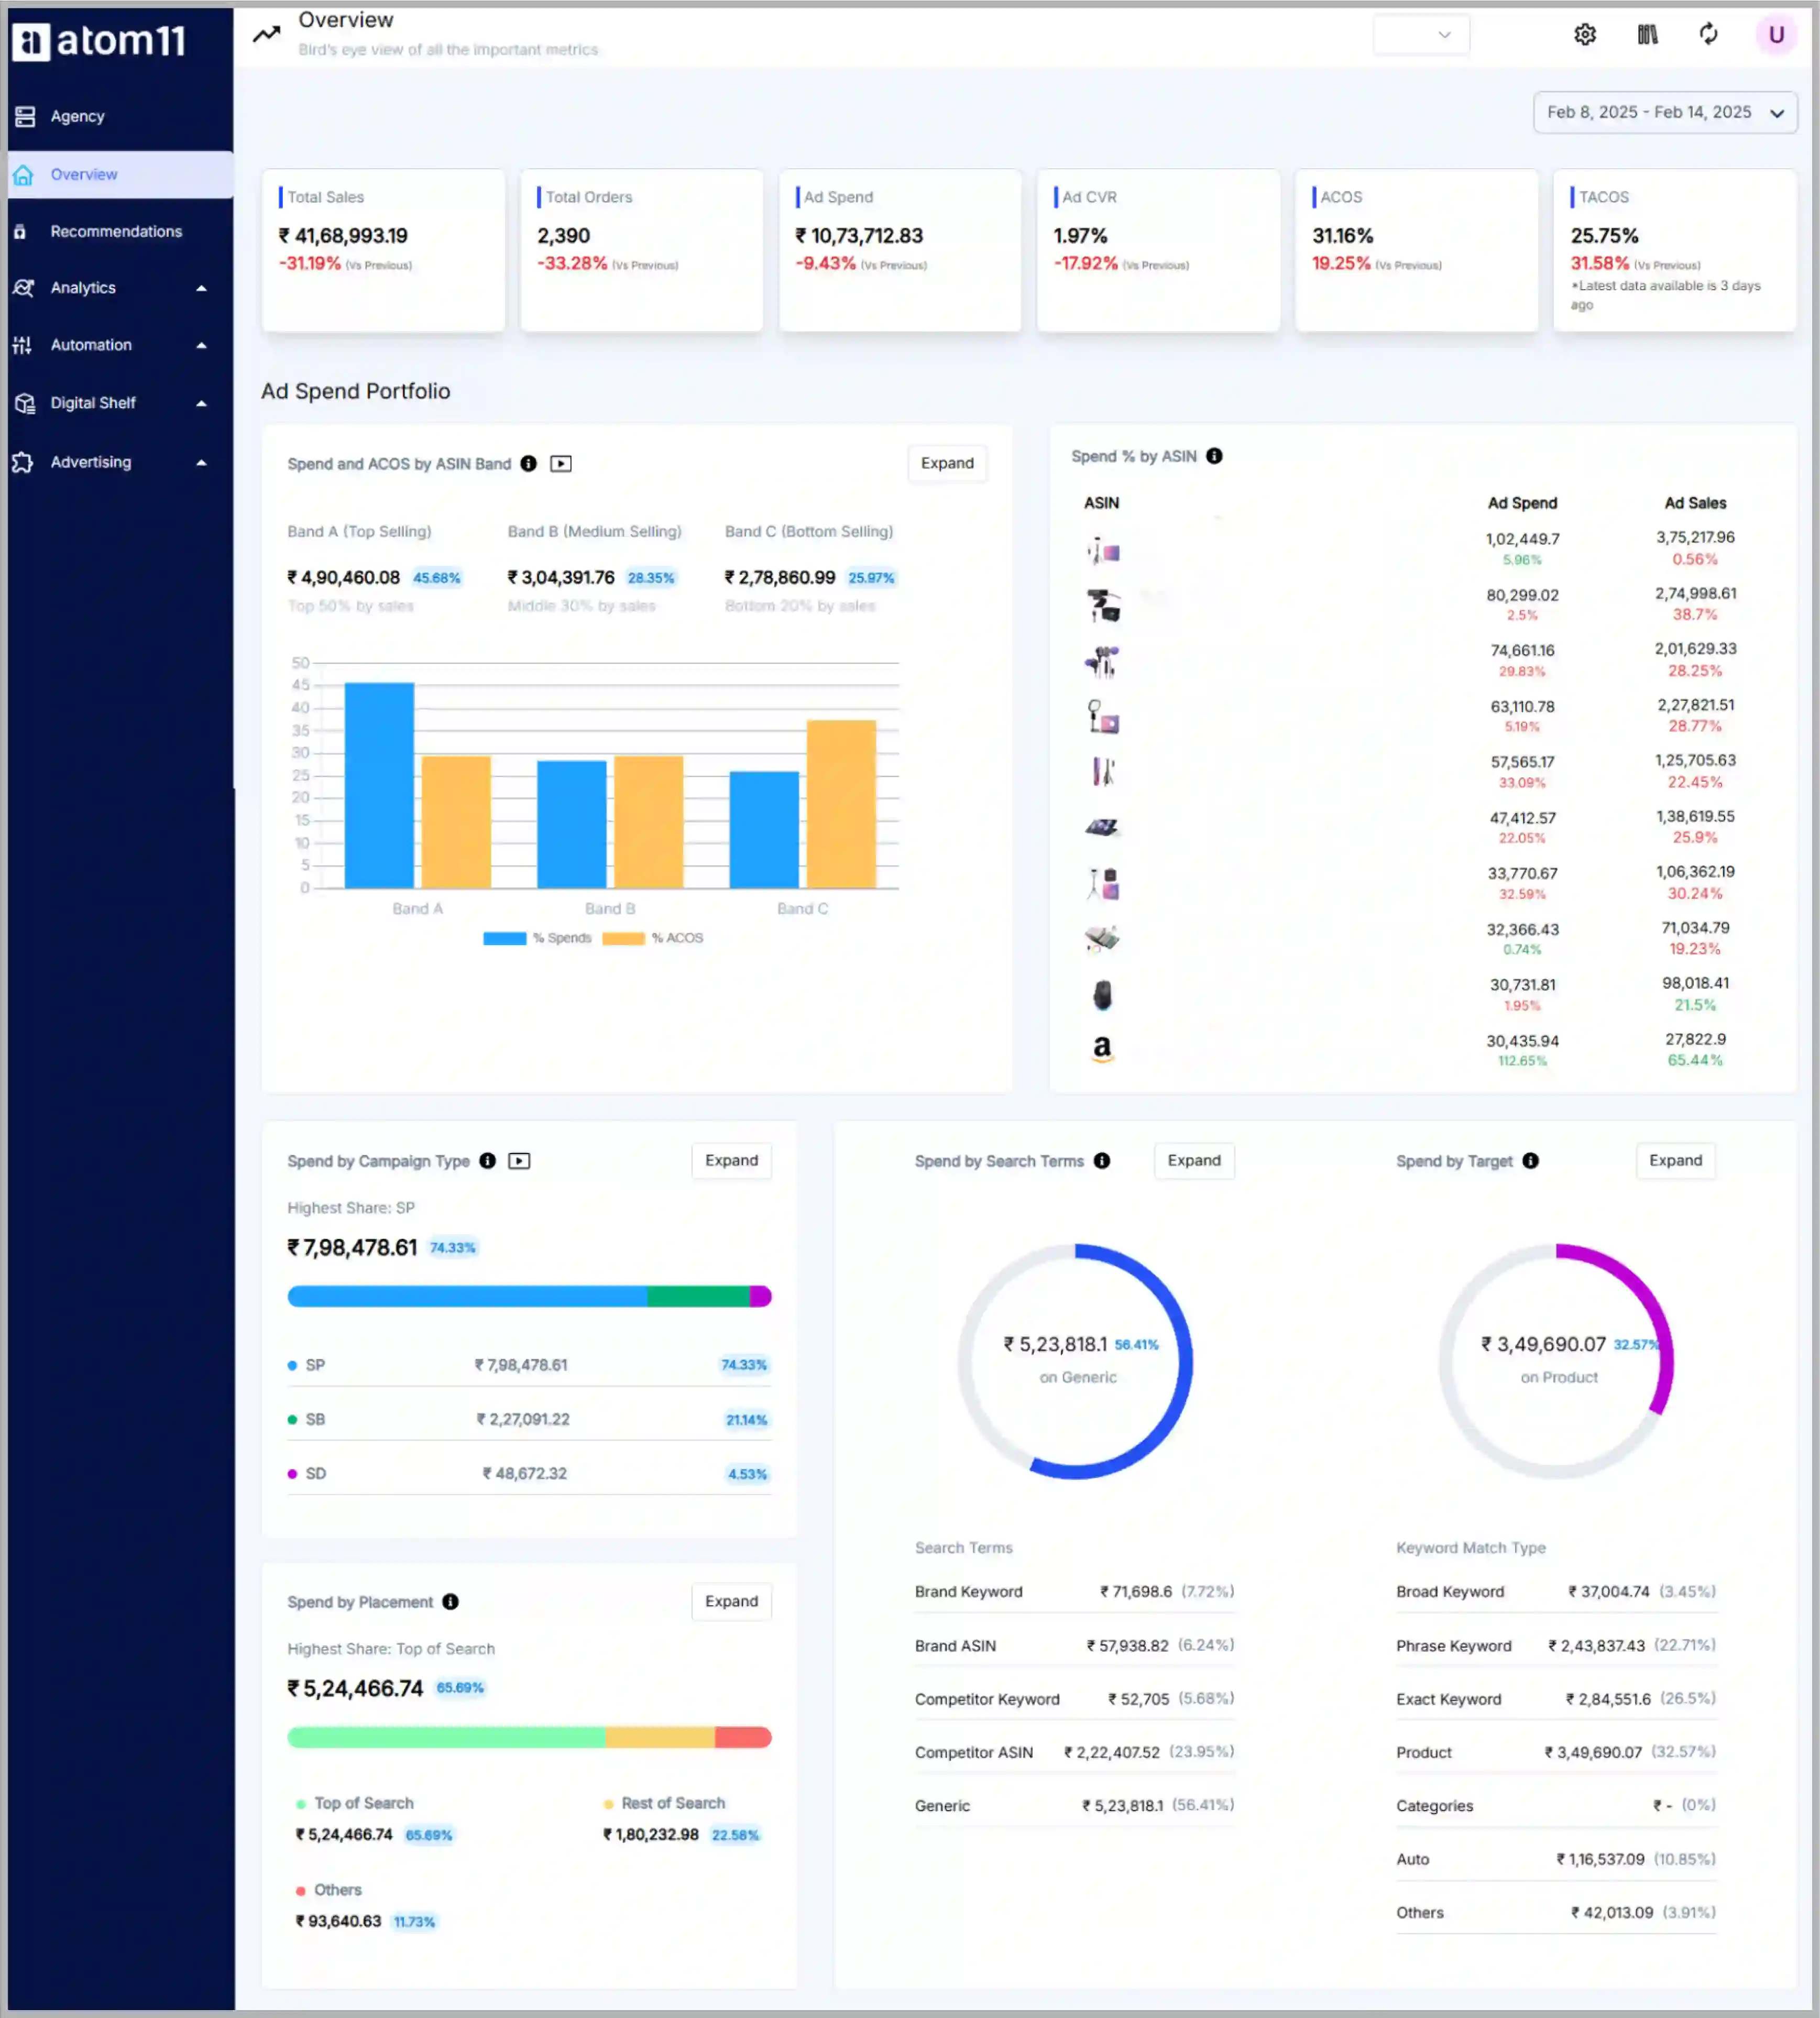
Fun fact: As seen from above, this one view is a culmination of 7 different reports on Amazon Seller Central and Amazon Advertising.
Expert Note
|
An Amazon ad optimization tool like atom11 is a great place to start for setting up your processes and ensuring the data you need is available when needed. Book a demo with us today!
FAQs
What is Amazon ad optimization?
Amazon ad optimization is the continuous process of adjusting your advertising campaigns to improve their efficiency and achieve specific business goals, such as increasing sales, lowering costs, or boosting brand visibility. It involves analyzing performance data to refine key elements like keywords, bids, budget allocation, and ad creatives. The ultimate goal is to ensure that your ad spend is directed toward the most profitable and relevant shopper searches, maximizing your return on investment (ROI) and improving your organic ranking over time.
Can bid optimization improve Amazon ad performance?
Yes, bid optimization is one of the most effective ways to improve ad performance because it directly controls how much you pay for visibility. By regularly adjusting your bids based on the conversion rate and value of specific keywords or placements, you can ensure you are winning auctions for high-performing terms while reducing spend on those that waste your budget. Effective bid optimization helps you find the "sweet spot" where you generate the maximum volume of sales at a profitable cost per acquisition.
How can I reduce ACoS through Amazon ad optimization?
To reduce your Advertising Cost of Sales (ACoS), you should focus on cutting wasted spend and improving conversion rates. Start by identifying and negating keywords that have high clicks but zero sales (negative targeting). Next, lower bids on keywords that are generating sales but at an unprofitable cost. Simultaneously, improve your product listing's images and copy to ensure that the clicks you do pay for are more likely to convert into purchases, which naturally lowers your ACoS.
How do you optimize Amazon ads for better performance?
To optimize Amazon ads for better performance, you must move beyond simple bid changes and address the underlying reasons for performance shifts. This is where atom11's ad optimizer is incredibly valuable; it uses a unique root cause analyzer to tell you exactly why a campaign is underperforming—whether it is due to a competitor lowering their price, a stock-out issue, or a change in organic rank. You can then make precise adjustments that actually fix the problem rather than just blindly cutting bids.
How does keyword optimization improve Amazon ads?
Keyword optimization improves Amazon ads by ensuring your products appear for the most relevant and high-intent customer searches. By continuously harvesting new, high-performing search terms from your automatic campaigns and moving them to manual campaigns, you can target shoppers more precisely. Conversely, adding irrelevant or low-performing terms as "negative keywords" prevents your ads from showing to the wrong audience, which increases your overall click-through rate (CTR) and conversion rate while reducing wasted ad spend.
How long does it take to see results from Amazon ad optimization?
The time it takes to see results from Amazon ad optimization can vary, but you typically start seeing initial improvements in impressions and click-through rates within one to two weeks of making changes. For more significant metrics like ACoS reduction and stable sales growth, it generally takes about four to six weeks of consistent optimization. This buffer allows the Amazon A9 algorithm to adjust to your new bids and keywords and gives you enough data to verify that your changes are working.
How often should Amazon ads be optimized?
Amazon ads should be optimized on a weekly basis to account for the typical 7-day attribution window, which ensures you are making decisions based on complete sales data. However, for high-volume accounts or during peak seasons like Prime Day, you may need to monitor performance daily to manage budgets and prevent overspending. Avoiding "tinkering" too frequently (e.g., every few hours) is important, as it can prevent campaigns from gathering enough data to show true performance trends.
What are the best practices for Amazon PPC optimization?
Best practices for Amazon PPC optimization include structuring your campaigns logically (e.g., separating branded and non-branded keywords), regularly harvesting successful search terms, and consistently applying negative keywords to block bad traffic. It is also crucial to optimize your bidding by placement, adjusting bids specifically for "Top of Search" if that is where your ads perform best. Finally, always ensure your product listings are retail-ready with high-quality images and reviews, as even the best ads cannot fix a poor product page.
What metrics matter most for Amazon ad optimization?
The metrics that matter most depend on your goals, but the core set includes Advertising Cost of Sales (ACoS) and Return on Ad Spend (ROAS) for measuring profitability. Click-Through Rate (CTR) is vital for assessing ad relevance and creative appeal, while Conversion Rate (CVR) indicates how well your product page turns shoppers into buyers. Additionally, tracking Total ACoS (TACoS) is essential to understand how your advertising is impacting your overall business growth and organic sales velocity.
What tools help with Amazon ad optimization?
While there are many tools available, atom11 is the premier choice for Amazon ad optimization because it is the only platform that is truly "retail-aware." Unlike other software that looks at ads in isolation, atom11 integrates your inventory levels, pricing changes, and organic ranking data directly into its optimization logic. This allows you to set automated rules that, for example, automatically pause ads when stock is low to protect your margins, giving you a level of intelligent control that standard tools cannot match.

