Blog
/
Amazon DSP Attribution Explained: Windows, Models, Metrics and the 2026 Changes
Amazon DSP Attribution: Windows, Models and 2026 Changes
Kajal Sharma
Amazon DSP attribution is the set of rules Amazon uses to decide which DSP ad impression or click gets credit for a shopper action such as a detail page view, an add to cart or a purchase. By default, Amazon DSP uses a 14 day, last touch model that credits both clicks and viewable impressions, prefers clicks over views, prefers the promoted product over other products from the same brand, and credits each conversion to only one ad interaction across every campaign and every advertiser.
That one paragraph hides a lot of detail that changes how you read your ROAS. Since January 2026, some view conversions follow a stricter model. Off Amazon conversions can be modeled. Multi touch metrics now sit next to last touch metrics in the DSP console. And sales can appear in your reports on a different date from when they actually happened.
This guide walks through each rule with worked examples and formulas, so you can explain every number in your DSP report to a finance team or a client. If you are new to the platform itself, start with our primer on how the Amazon demand side platform works.
Key Takeaways
Amazon DSP credits conversions that happen within 14 days of an eligible click or viewable impression.
When a shopper touches several ads, Amazon ranks them in this order: promoted product clicks, brand halo clicks, promoted product views, brand halo views. The most recent interaction in the winning tier gets the credit.
A conversion is credited once, across all Amazon Ads campaigns and advertisers. DSP competes with your Sponsored Ads for the same sale.
Sales are reported on the date of the ad interaction, not the purchase date, so the last 14 days of any report are still filling in.
From January 1, 2026, view attribution for DSP ads on Amazon Store inventory uses shopping signals and a shorter window. The legacy 14 day view numbers live on in Purchases (all views) metrics.
For the full picture, pair last touch reports with multi touch metrics, conversion path reporting, Amazon Marketing Cloud (AMC) and incrementality tests.
What Is Amazon DSP Attribution?
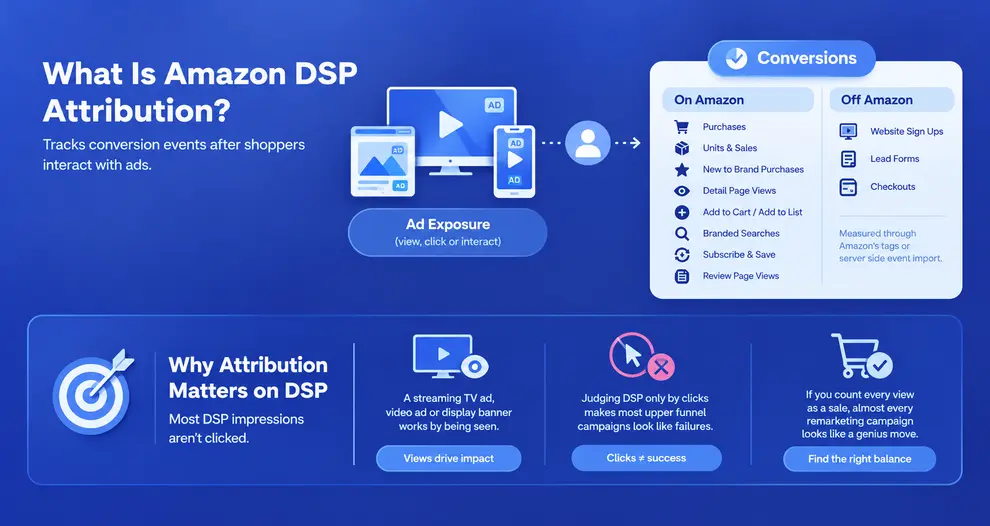
Amazon defines attribution as the measurement of conversion events that occur after shoppers interact with ads. For Amazon DSP, those conversion events fall into two families:
On Amazon conversions: purchases, units, sales, new to brand purchases, detail page views, add to cart, add to list, branded searches, Subscribe and Save subscriptions and product review page views.
Off Amazon conversions: actions on your own website or app, such as a sign up, a lead form or a checkout, measured through Amazon's tags or server side event import.
Attribution matters more on DSP than on search ads for one simple reason. Most DSP impressions are never clicked. A streaming TV ad, an online video ad or a display banner on a news site does its job by being seen. If you judge DSP only by clicks, almost every upper funnel campaign looks like a failure. If you accept every view as the cause of a sale, almost every remarketing campaign looks like a genius move. Good DSP attribution analysis lives between those two extremes
How Amazon DSP Attribution Works: The Three Rules
Every DSP conversion passes three tests before it is credited to a campaign. Amazon describes them in its ad campaign attribution documentation.
Rule 1: Product relevance (promoted vs brand halo)
When you build a DSP order, you add the products you want to track. Those tracked ASINs are your promoted products. DSP managing can also claim credit for brand halo products, which Amazon defines as products within the same brand and subcategory as a promoted ASIN.
Example: You promote a pair of over ear headphones. A shopper sees your ad, then buys your wireless earbuds from the same brand. If the earbuds sit in the same subcategory (Headphones), that purchase can be credited to your campaign as a brand halo conversion. A charging cable from the same brand in a different subcategory would not count as halo for that campaign.
In Demand Side Platform reporting, halo metrics are labeled "brand halo" (often abbreviated BH), and Total metrics combine promoted and brand halo results.
Practical tip: Track every ASIN you genuinely want the order to drive. If a product is left off the tracked list, its sales can only show up as halo, and only when it shares a subcategory with a tracked product. Missing ASINs are one of the most common reasons DSP looks weaker than it is.
Rule 2: Ad interaction type (clicks and views)
Unlike click only ad types, all Amazon DSP campaigns attribute conversions to both clicks and views. A view counts only when the impression met Amazon's viewability standard: at least 50% of the ad's pixels on screen for 1 second or more for display ads, or 2 seconds or more for video ads. Where viewability cannot be measured directly, Amazon infers it from historical data and placement characteristics.
Standard DSP metrics such as Purchases and ROAS include both click and view conversions. Click only breakouts, such as "ROAS from clicks" or "Purchases from clicks", are labeled separately.
Rule 3: The lookback window
The lookback window is the maximum number of days a conversion is still considered related to an ad interaction. For Amazon DSP, the standard window is 14 days for clicks and views. The 2026 change for some view conversions is covered below.
The Amazon DSP Attribution Window, With Examples
Amazon's own illustration makes it clear: with a 14 day lookback, a purchase on October 17 can be credited to ad interactions between October 3 and October 17. An impression on October 2 is out of range.
Sales Show up on the Ad Interaction Date
This is the rule that confuses most teams. Amazon reports attributed conversions on the date of the ad interaction, not the date of the purchase. Conversions can also take up to 12 hours to appear, and the numbers for any report date stay incomplete until that date's lookback window closes.
Example: A shopper sees your DSP video ad on September 1 and buys on September 12. The sale appears in your September 1 row. If you pulled your report on September 5, that sale was not in it yet. Pull the same report on September 20 and September 1 suddenly looks better.
On top of that, payment failures and orders cancelled within 72 hours are deducted from attribution metrics, and those deductions can take up to 7 days to process. So a report date is truly settled only about three weeks after it happened.
Formula: Project final ROAS from immature data
Because recent days are always underreported, early ROAS readings are biased downward. A simple fix is to build your own "attribution maturity curve" from past campaigns.
Completeness factor at day n = Attributed sales for a report date as of day n ÷ Attributed sales for the same date once settled (day 21)
Projected final ROAS = Current ROAS ÷ Completeness factor
Example: Looking back at your last three months of remarketing data, a report date typically holds 55% of its final sales after 3 days, 80% after 7 days and 100% after 21 days. Today your 3 day old data shows ROAS of 2.2.
Projected final ROAS = 2.2 ÷ 0.55 = 4.0
The curve is different for every account. Prospecting and streaming TV usually fill in more slowly than remarketing, because shoppers exposed earlier in the funnel take longer to buy. Calculate one curve per tactic, and you will stop pausing good ad groups on day three.
How Ads Compete for Credit: The Attribution Priority Ladder
Amazon DSP does not live in its own Amazon attribution bubble. DSP, Sponsored Brands, Sponsored Display, Streaming TV and (for vendors) Sponsored Products all compete for the same conversion. According to Amazon's documentation, when a shopper interacted with more than one eligible ad, Amazon first considers product relevance, then uses a last touch model that prioritizes the last click over the last view.
Priority | Interaction that wins credit |
1 | Promoted ASIN ad click |
2 | Brand halo ad click |
3 | Promoted ASIN ad view |
4 | Brand halo ad view |
A conversion is credited to no more than one ad interaction across all campaigns and all advertisers. The same sale cannot be counted as both promoted and halo, or as both a view and a click.
Worked Example: How Amazon DSP Attributes a Purchase
A shopper interacts with a headphone brand's ads over two weeks:
Date | Interaction | Campaign | Relevance to final purchase |
Oct 3 | Views a streaming TV ad for the headphones | DSP awareness | Promoted view |
Oct 8 | Clicks a display ad for the brand's earbuds | DSP consideration | Brand halo click |
Oct 12 | Views a remarketing ad for the headphones | DSP remarketing | Promoted view |
Oct 14 | Buys the headphones |
Many people expect the October 12 remarketing view to win, because it came last. It does not. There is no promoted click, so the ladder moves to tier 2, and the brand halo click on October 8 takes the credit. The consideration campaign gets the sale, the remarketing campaign gets nothing, and the streaming TV ad, which may have started the whole journey, gets nothing either.
This is exactly why single touch reports undervalue awareness tactics, and why the multi touch tools covered later exist.
Note for sellers running DSP
Sellers who also run Sponsored Products should enter their merchant token in their Amazon DSP account configuration. Amazon uses it to make sure the same advertiser is not credited twice for one conversion, once as a merchant and once as a brand.
The 2026 Amazon DSP Attribution Change: Shopping Signal View Attribution
If your DSP ROAS dropped at the start of 2026 without an obvious cause, this is the most likely reason.
Starting January 1, 2026, Amazon introduced a shopping signal enhanced last touch model for view based attribution on Amazon Store inventory. It applies to Amazon DSP ads served on Store inventory, along with vCPM Sponsored Brands and Sponsored Display. Instead of crediting any viewable impression inside 14 days, the model credits views that reached shoppers during discovery moments, such as exploratory browsing or general category searches, and it uses a shorter window. Click attribution did not change, and neither did other inventory types.
What that means in practice:
Standard DSP purchase, sales and ROAS metrics now use the new model for affected views.
Purchases (all views) metrics keep the old rules, crediting all eligible viewable impressions within 14 days. Use them for year over year comparisons.
Actual sales did not change. Only the share of them credited to views did.
Formula: Measure your view attribution gap
View attribution gap % = (Purchases (all views) minus Standard purchases) ÷ Purchases (all views) × 100
Example: Last month a remarketing ad group shows 1,000 Purchases (all views) and 780 standard Purchases.
(1,000 minus 780) ÷ 1,000 × 100 = 22%
So 22% of the view conversions the old model would have credited no longer qualify. When you compare 2026 against 2025, compare Purchases (all views) in 2026 against standard Purchases in 2025. Otherwise you are comparing two different rulebooks and blaming the campaign for a measurement change.
A large gap is also a useful signal on its own. Ad groups that lose the most credit under the new model were leaning heavily on passive views of shoppers who were already going to buy. Those are exactly the ad groups to put through an incrementality test.
Amazon DSP Attribution Metrics and the Formulas Behind Them
Your DSP reports contain dozens of conversion metrics. These are the ones that matter most for attribution analysis.
Metric | What it tells you | Formula |
Total ROAS | Sales per unit of spend, promoted plus brand halo | Total sales ÷ Total cost |
ROAS from clicks | Efficiency when only clicked ads get credit | Click attributed sales ÷ Total cost |
Effective cost per purchase (eCPP) | What each attributed purchase cost | Total cost ÷ Total purchases |
Purchase rate | How often an impression led to a purchase | Total purchases ÷ Impressions |
New to brand % | Share of purchases from shoppers who had not bought from the brand in the previous 365 days | New to brand purchases ÷ Total purchases |
Cost per detail page view | Price of consideration | Total cost ÷ Detail page views |
Brand halo share | How much of the credited revenue came from products you did not promote | Brand halo sales ÷ Total sales |
View share | How dependent reported results are on views | View attributed purchases ÷ Total purchases |
A few details from Amazon's attribution documentation that change how you read these numbers:
Attributed sales use the unit price shown in the cart. Many cart level discounts, such as coupons, lightning deals and some tentpole event pricing, are not subtracted, and tax is excluded. During Prime Day or Black Friday, attributed sales can therefore run above your real net revenue.
Depending on the campaign type, attributed sales can include units sold by Amazon or by another seller, and even used condition items. If a reseller holds the Buy Box on your ASIN, your DSP report may be crediting sales you did not earn.
In reports grouped by advertised ASIN, the ASIN is the one in the ad, but the attributed sales can include other ASINs.
For a deeper look at the efficiency metrics themselves, see our guide on how to calculate Amazon ROAS.
Off Amazon Conversion Attribution in Amazon DSP
Amazon DSP is one of the few Amazon ad products that can send traffic to a brand's own website or app and measure what happens there. Brands selling direct to consumer, service businesses and app publishers rely on this.
How off Amazon conversions are tracked
Amazon Ad Tag: a JavaScript tag placed on your site that fires on events such as page views, sign ups, add to cart and checkout. It replaced the older DSP pixels.
Server side event import: Amazon's Conversions API lets you send conversion events from your server, which is more resilient to browser restrictions and ad blockers.
Offline events: in store or CRM conversions can be uploaded and matched in a privacy safe way.
Once events are flowing, you pick which ones matter in the DSP order, and they appear as off Amazon conversions in campaign reporting.
Modeled conversions
Not every off Amazon conversion can be linked to an ad interaction. Some impressions serve on anonymous supply, and some browsers break the link between an ad view and a later site visit. Since August 2024, Amazon DSP has used modeled attribution for off Amazon conversions for US advertisers. Directly measured and modeled conversions are reported together as one combined result in the campaign manager, the reporting center and the API.
Two practical consequences:
You cannot split modeled from measured conversions in the standard metric, so compare trends in DSP against your own site analytics rather than expecting a line by line match.
Modeled conversion rates settle over time. Give a new campaign one to two weeks before judging its off Amazon performance.
Formula: Reconcile DSP with your own analytics
Capture ratio = DSP attributed off Amazon conversions ÷ Conversions your own analytics credits to the DSP campaign (by UTM or landing page)
Example: DSP reports 420 sign ups in a month. Your analytics tool credits 300 sign ups to the DSP landing page by last click. The capture ratio is 1.4. That gap is expected, because DSP counts views and modeled conversions while most site analytics count only clicks. Watch the ratio over time. If it jumps from 1.4 to 3.0 without a change in strategy, check for a broken tag, a duplicate event or a change in supply.
Amazon Attribution vs Amazon DSP Attribution
Search results for "Amazon DSP attribution" often mix in Amazon Attribution, which is a different product. The difference matters when you are setting up measurement.
Amazon DSP attribution | Amazon Attribution | |
What it measures | Conversions from Amazon DSP ads | How non Amazon marketing (Google, Meta, email, influencers) drives shopping on Amazon |
How it tracks | Built into DSP reporting, plus Ad Tag and event import for off Amazon conversions | Attribution tags added to your external ad and link URLs |
Interactions credited | Clicks and viewable impressions | Clicks on tagged links |
Default model | 14 day last touch with the priority ladder | |
Cost | Included in DSP | Free for eligible sellers, vendors and brand owners |
In short: use DSP attribution to evaluate DSP. Use Amazon Attribution to evaluate traffic you send to Amazon from other channels. Our Amazon Attribution guide covers the second one in detail.
Beyond Last Touch: Advanced Amazon DSP Measurement
Last touch is a convention, not a measure of cause. Amazon's own science team makes the point well: in its paper on Amazon Ads multi touch attribution, it cites a large study of roughly 2,000 Meta advertising campaigns in which purely observational models misestimated ad effects by 488% to 948%, depending on the model and outcome. That is the risk of trusting any attribution model that is not checked against experiments.
Here are the tools Amazon offers to go further.
Multi touch attribution in the DSP console
Amazon's multi touch attribution divides credit for a purchase across the Amazon Ads touchpoints a shopper saw, in proportion to their likely contribution. It combines randomized experiments, machine learning and shopping signals. For US advertisers, metrics such as Purchases (multi touch), Sales (multi touch) and ROAS (multi touch) appear next to the standard last touch metrics in the Amazon DSP campaign manager and in DSP custom reports.
How to use it: Compare each campaign's multi touch sales with its last touch sales.
Credit shift ratio = Multi touch sales ÷ Last touch sales
A ratio above 1 means the campaign is undervalued by last touch (typical for streaming TV, video and prospecting). A ratio below 1 means it is overvalued (typical for remarketing that catches shoppers at the finish line). If your streaming TV campaign shows $8,000 last touch sales and $20,000 multi touch sales, its ratio is 2.5. Before cutting it, look at that number. Read more in our guide to multi touch attribution.
Conversion path reporting
Conversion path reporting shows the most common sequences of ad touchpoints in the 30 days before a purchase, across Sponsored Ads and Amazon DSP, ranked by sales. Use it to spot which DSP tactics tend to appear early in winning paths, even when they rarely take last touch credit.
Amazon Marketing Cloud
Amazon Marketing Cloud is Amazon's clean room. It gives you event level, anonymized data so you can write your own attribution logic in SQL: custom lookback windows (including windows longer than 14 days for considered purchases), first touch or position based models, frequency to conversion analysis and exposed vs unexposed comparisons. Our Amazon Marketing Cloud guide explains how to get started.
Omnichannel Metrics
For brands sold at other retailers too, Omnichannel Metrics estimates how Amazon DSP exposure drives sales beyond Amazon. Since July 2026, US advertisers on self service and managed service DSP can see retailer level breakouts of units and sales, based on Amazon Shopper Panel data and third party signals.
Long term sales
Amazon's long term sales metric estimates the sales a brand can expect over the next year based on how well a campaign moves new to brand shoppers down the funnel. It is useful for justifying acquisition focused DSP campaigns whose 14 day ROAS looks thin.
How to Audit Your Amazon DSP Attribution: A Five Step Framework
Reported ROAS in DSP can look extraordinary. Remarketing ad groups reporting ROAS of 20, 50 or even more than 100 are not unusual. Those numbers are rarely wrong in a technical sense. They are simply answering a different question from the one your CFO is asking. Run these five checks on every DSP account before you scale it.
Step 1: Check view share
View share = View attributed purchases ÷ Total purchases
If an ad group shows a view share above 85% and it targets past detail page viewers or past purchasers, most of its credit comes from shoppers who saw an ad and bought anyway. That does not mean the ad did nothing, but it does mean the reported ROAS is an upper bound.
Step 2: Check halo share
Halo share = Brand halo sales ÷ Total sales
A high halo share is fine for a brand building campaign. It is a warning sign for a campaign meant to launch one specific product. If 70% of a launch campaign's sales are for your bestseller, the launch is riding on the bestseller's demand.
Step 3: Check new to brand share
Campaigns built for acquisition should show a meaningfully higher new to brand % than your remarketing. If prospecting and remarketing report similar new to brand shares, your audiences probably overlap and need exclusions.
Step 4: Compare against the Purchases (all views) and multi touch versions
Put standard, all views and multi touch results for each campaign side by side. The campaigns whose numbers swing the most between models are the ones where attribution choices, not performance, are driving your decisions.
Step 5: Test incrementality
Attributed ROAS tells you what DSP touched. Incremental ROAS tells you what DSP caused.
iROAS = (Purchase rate of exposed group minus Purchase rate of holdout group) × Exposed shoppers × Average order value ÷ Ad spend
Example: A remarketing ad group reaches 150,000 shoppers and reports ROAS of 9.0. A randomized holdout of the same audience, never shown the ads, purchases at 2.1%, while the exposed group purchases at 2.6%. Average order value is $40 and spend is $6,000.
(0.026 minus 0.021) × 150,000 × $40 ÷ $6,000 = 5.0
The ad group is still profitable, but the true return is closer to 5 than 9. Compare iROAS with your break even ROAS (1 ÷ contribution margin) when deciding whether to scale. Holdouts can be built with AMC audiences or Amazon's lift studies.
Common Amazon DSP Attribution Mistakes
Mistake | Why it hurts | Fix |
Judging the last 7 days of data | Sales post to the interaction date and are still arriving | Use a maturity curve or wait 14 to 21 days |
Comparing 2026 ROAS with 2025 ROAS directly | View attribution rules changed on January 1, 2026 | Compare Purchases (all views) in 2026 with standard metrics in 2025 |
Leaving ASINs off the tracked list | Their sales only count as halo, if at all | Track every ASIN the order is meant to drive |
Reading promoted metrics only | Misses halo value of the whole brand | Use Total metrics, then check halo share |
Holding streaming TV to remarketing ROAS | Upper funnel ads rarely win last touch | Use multi touch metrics, new to brand and brand lift |
Adding DSP and Sponsored Ads attributed sales together | Each sale is credited once, but comparing channels on different models distorts the mix | Look at account level total sales and TACOS alongside channel reports |
Expecting DSP to match retail reports | Different dates, no cart discounts, no tax, other sellers | Reconcile trends, not individual days |
Sellers skipping the merchant token | Conversions may be deduplicated incorrectly | Add the merchant token to the DSP account configuration |
How Atom11 Helps Brands and Agencies Manage DSP Attribution at Scale
Every check above is manageable for one advertiser. It gets heavy for an agency running DSP for a dozen brands, or a brand running dozens of orders across markets. The work is not the analysis itself. It is pulling promoted, halo, total, all views and multi touch metrics from several reports, lining them up with Sponsored Ads and retail data, and doing it again every week while the numbers keep maturing.
Whether you use Amazon's native console, AMC directly or a third party platform, look for these capabilities:
Unified reporting: DSP and Sponsored Ads side by side, with promoted, halo and total metrics, so you can see the full funnel in one place.
Retail context: inventory, price and Buy Box data next to ad metrics, so a drop in attributed sales can be traced to a stockout or a lost Buy Box rather than blamed on the campaign.
AMC access without heavy SQL: templates for path to purchase, frequency and overlap analysis, and the ability to push audiences back into DSP.
Operational controls: bulk creation, cross order pacing and frequency caps by audience, so fixes found in attribution analysis can be applied quickly.
Plain language analysis: a way to ask why performance changed instead of rebuilding the same pivot table.
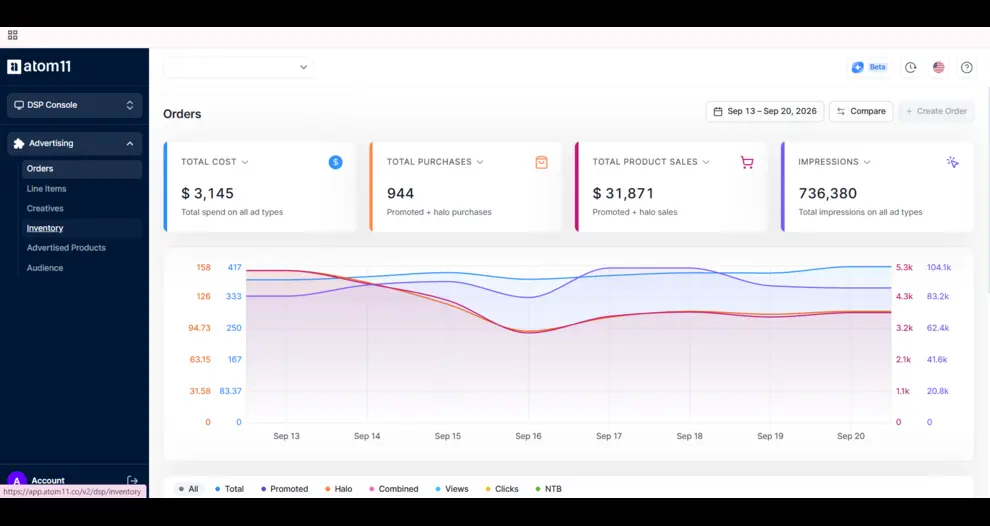
Atom11 is one example of a platform in this category. Its Amazon DSP module brings DSP and Sponsored Ads reporting into one dashboard with promoted, halo and combined metrics, supports AMC audiences, and lets teams bulk create orders and ad groups, pace across orders and set frequency caps per audience. Teams that prefer working in an AI assistant can also connect their Amazon Ads data through the Atom11 MCP. For agencies, the time saved on report stitching is usually where the value shows up first.
As with any tool, trial it against your own reporting workflow, and check how it handles the 2026 view attribution metrics and multi-touch data before committing.
Conclusion
Amazon DSP attribution is not complicated once you know the rules. Conversions count within 14 days. Clicks beat views, promoted products beat halo products, and the most recent interaction in the winning tier takes the credit, once, across every Amazon ad. Sales land on the ad interaction date, so fresh data always looks worse than it will. Since January 2026, some view conversions follow a stricter shopping signal model, and Purchases (all views) is your bridge to past performance.
The brands and agencies that get the most from DSP treat last-touch ROAS as one lens, not the verdict. They check view share, halo share and new-to-brand share, compare last touch with multi-touch, look at conversion paths in AMC, and run holdout tests on the ad groups that matter most. Do that consistently, and you will stop cutting the campaigns that build demand and stop overfunding the ones that simply show up at checkout.
FAQs
What is the attribution window for Amazon DSP?
The standard Amazon DSP attribution window is 14 days for both clicks and viewable impressions. A purchase is eligible if the shopper interacted with the ad within the 14 days before converting. Since January 1, 2026, view attribution on Amazon Store inventory uses shopping signals and a shorter window, while Purchases (all views) metrics keep the full 14 day view window.
Does Amazon DSP use last touch attribution?
Yes. Standard Amazon DSP reporting uses a last touch model that prioritizes product relevance and clicks over views. The order is promoted clicks, brand halo clicks, promoted views, then brand halo views. For US advertisers, multi touch attribution metrics are also available alongside last touch metrics in the DSP campaign manager.
What changed in Amazon DSP attribution in 2026?
From January 1, 2026, Amazon applied a shopping signal enhanced last touch model to view based attribution for Amazon DSP ads on Amazon Store inventory. It credits views during discovery moments and uses a shorter window, which lowered view attributed conversions for many advertisers. Click attribution did not change. The legacy view numbers are available as Purchases (all views) metrics.
What is brand halo in Amazon DSP?
Brand halo refers to conversions on products that were not promoted in the campaign but belong to the same brand and subcategory as a promoted ASIN. DSP reports show halo results separately, and Total metrics combine promoted and brand halo conversions.
How does Amazon DSP attribute off Amazon conversions?
Off Amazon conversions are tracked with the Amazon Ad Tag on your website or by sending events through Amazon's Conversions API. For US advertisers, DSP also models conversions that cannot be directly linked to an ad, such as those from anonymous supply, and reports measured and modeled conversions together.
