Blog
/
How to Optimize Amazon DSP Campaigns: The Levers That Actually Move Performance
How to Optimize Amazon DSP Campaigns: The Levers That Actually Move Performance
Neha Bhuchar
Key Takeaways
Check Amazon's pre flight and in flight DSP recommendations before making any manual bid or frequency change, since they are built from the platform's own delivery data for that campaign's goal and locale.
Track weekly frequency against weekly reach for every line item. When frequency growth outpaces reach growth, the audience is saturated, so lower the frequency cap or broaden the audience instead of raising budget.
Benchmark effective CPM against Amazon's recommended range for the specific campaign goal and locale, not a generic industry number.
Let a new or underperforming audience clear roughly 20,000 to 30,000 impressions before narrowing it, and refine with exclusions before rebuilding it from scratch.
Refresh prospecting creative monthly and retargeting creative every 3 to 4 weeks, watching CTR and detail page view rate for fatigue signals.
Automatically exclude recent purchasers from prospecting audiences and pull out of stock or lost Buy Box ASINs from active retargeting.
Match the attribution window and model to the product's real purchase cycle before judging any other lever's performance.
Use hourly and day of week delivery data to weight bids and budgets toward the hours that actually convert.
Optimizing an Amazon DSP campaign is not one action, it is a set of levers, bid and CPM, frequency, audience composition, creative, exclusions, and attribution, each of which moves performance differently depending on what stage the campaign is in. Most advice on this topic treats optimization as a single checklist run once. In practice it is closer to a rotation: different levers matter before launch, in the first two weeks, and after a campaign has enough volume to trust its own data.
This guide walks through each lever in that order, starting with the one most advertisers skip entirely: the optimization guidance Amazon's own DSP console already generates for every campaign, before a single dollar has been spent.
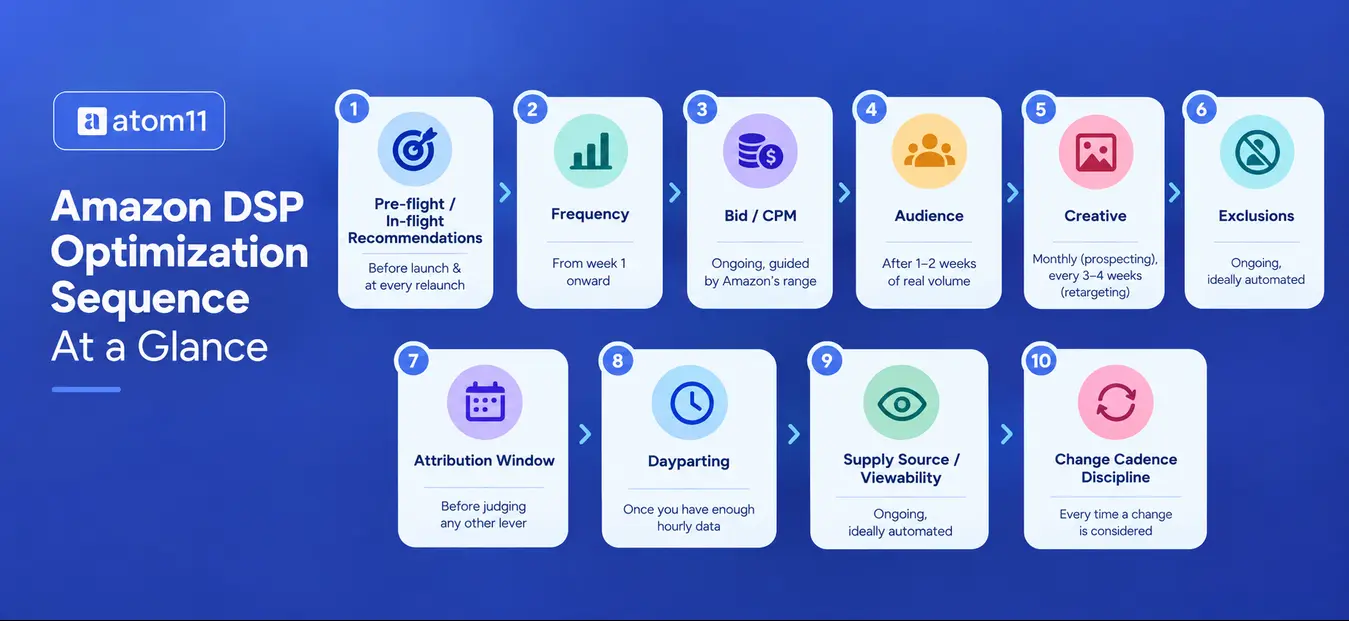
The Optimization Sequence At a Glance
Before diving into each lever, here's the order they tend to matter in and what a healthy reading looks like for each one.
Lever | When it matters most | What “good” looks like |
Pre-flight / in-flight recommendations | Before launch, and again at every relaunch | Bid and frequency settings sit inside Amazon's suggested range |
Frequency | From week 1 onward | Frequency growth stays at or below reach growth, week over week |
Bid / CPM | Ongoing, informed by guidance above | Effective CPM tracks close to Amazon's recommended ceiling |
Audience | Once a line item has 1–2 weeks of real volume | CPA holds or improves without shrinking total reach |
Creative | Monthly (prospecting), every 3–4 weeks (retargeting) | CTR / detail page view rate holds steady as frequency rises |
Exclusions | Ongoing, ideally automated | Recent purchasers and out-of-stock or lost-buy-box ASINs are never targeted |
Attribution window | Before judging any of the levers above | The window and model match the product's real purchase cycle |
Dayparting | Once you have enough hourly delivery data | Spend concentrates in the hours that actually convert |
Supply source / viewability | Ongoing, ideally automated | Low-viewability and underperforming domains are excluded, not just flagged |
Change cadence discipline | Every time a change is considered | Each lever is changed at most once per attribution cycle |
1. Start With What Amazon Already Tells You: Pre Flight and In-Flight Recommendations
Before optimizing anything by hand, check what Amazon Demand Side Platform is already recommending. This is the most underused lever in most accounts, largely because it sits inside a guidance panel that is easy to miss during setup.
Amazon's own DSP recommendations engine compares the maximum average CPM and line item frequency cap an advertiser has set against machine learning generated suggestions built from campaign goal, geographic locale, and ad line settings, then surfaces a pre flight recommendations alert before the campaign goes live. The stated purpose is to reduce delivery issues and cut down on mid-flight adjustments that would otherwise be needed once the campaign is already spent. This feature is available to self service advertisers across more than 40 countries and territories spanning North America, South America, Europe, the Middle East, and Asia Pacific.
The same guidance extends past launch through the DSP Guidance API, which surfaces the same CPM, frequency cap, and viewability targeting recommendations available in the console, but programmatically and both pre flight and in flight, meaning the same optimization signal that used to require manually checking the console panel can now be pulled automatically at the line item, order, or advertiser level. A companion Quick Actions API lets advertisers reference the recommendation's action ID and apply it directly, closing the loop between seeing a recommendation and acting on it.
In practice, this means the single highest leverage first step in optimizing any DSP campaign is not adjusting a bid manually, it is opening the guidance panel, or querying the Guidance API if you have programmatic access, and checking what Amazon's own delivery data is already suggesting before making any other change.
EXAMPLE: A home fragrance brand launches a new prospecting order with a self-selected $9.00 maximum average CPM. The guidance panel flags a recommended range of $11–$13 for that campaign's goal and locale. Left as-is, the campaign under-delivers against its pacing target for the first ten days because it's bidding below what the auction actually requires, a problem a five-second check before launch would have avoided.
2. Frequency Optimization: The Formula Behind Reach Saturation
Frequency is the lever most advertisers either ignore or set once and never revisit, yet it is usually the fastest one to diagnose and the fastest to fix.
Frequency = Total Impressions ÷ Unique Reached Users
Track weekly frequency against weekly reach for each line item. When frequency is climbing while reach has flattened, the audience pool is saturated:
Saturation Signal = Week Over Week Frequency Growth % > Week Over Week Reach Growth %
Once that signal appears, adding budget will not buy more reach, it will just push frequency higher against the same users, which increases cost without adding new exposure. The fix is not a bigger budget, it is either a lower frequency cap, a broader audience, or moving budget into a use case with more available reach. Most managed accounts settle into 3 to 4 impressions per user per week for prospecting audiences and slightly higher for retargeting, though the right ceiling depends on category and how often creative is refreshed, which is the next lever.
EXAMPLE: A retargeting line item runs 20,000 impressions against 4,000 unique users in week 1 (frequency: 5.0). By week 4 it's running 24,000 impressions against 4,100 users (frequency: 5.85). Reach grew about 2.5% while frequency grew about 17%, a clear saturation signal. Rather than raising the budget, the fix here is widening the audience or lowering the frequency cap so incremental spend goes toward reach instead of repetition.
3. Bid and CPM Optimization Using Pre Flight Guidance
Manual CPM adjustment is where most advertisers spend the bulk of their optimization time, but it is more effective once it is informed by the recommendations covered above rather than done from a flat starting assumption.
Effective CPM = (Total Spend ÷ Total Impressions) × 1000
Compare effective CPM against Amazon's recommended maximum average CPM for the campaign goal and locale, not against a generic industry benchmark, since the recommendation already accounts for the specific auction dynamics of that campaign's targeting and geography. A bid set meaningfully below the recommendation usually shows up as under delivery against pacing targets, while a bid set well above it usually shows up as delivery that is fine but efficiency that lags similar campaigns.
Cost discipline during CPM optimization compounds. Amazon's own data on cost controls during Prime Day found display campaigns using them saw a 2.6X uplift in ad attributed sales compared to campaigns without, which is a useful reminder that tighter cost guardrails generally outperform looser ones, even outside high volume events.
EXAMPLE: A supplement brand's prospecting campaign spends $8,400 across 1.2 million impressions, an effective CPM of $7.00. Amazon's guidance panel recommends a $9–$11 ceiling for that goal and locale. The gap suggests the campaign is bidding conservatively enough to be losing competitive auctions, which typically shows up as flat or declining weekly reach even though the budget isn't fully spent.
4. Audience Optimization Without Shrinking Reach Too Fast
Audience refinement is where the most damage happens from overcorrection. A line item that appears to be underperforming is often not a targeting failure, it is an audience that has not accumulated enough volume yet to read reliably.
Before narrowing an audience, separate two different problems: an audience that is genuinely mismatched to the product, which shows up as a persistently high cost per acquisition even after adequate delivery, and an audience that simply has not delivered enough impressions to trust the data, which is a volume problem, not a targeting problem. Narrowing the second case too early is one of the most common ways accounts shrink their own reach for no real gain.
Once an audience is confirmed underperforming, refine in this order: first exclude the segments within it that are clearly mismatched using exclusion targeting rather than rebuilding the whole audience, then test a narrower version of the same audience type, and only build an entirely new audience once both of those have been tried. This order preserves the learning already accumulated instead of resetting delivery history every time.
EXAMPLE: A kitchenware brand's in-market “Home & Kitchen shoppers” segment shows a $38 CPA against a $22 target after only four days and 6,000 impressions. Pausing or rebuilding it now would reset all delivery history. Waiting until it clears roughly 20,000–30,000 impressions, a more reliable read for that audience size, shows CPA settling to $24, close enough to target that no rebuild was needed at all.
5. Creative Optimization and Refresh Cadence
The same creative asset run against the same audience for months loses effectiveness well before frequency capping alone would explain the drop, a pattern usually called creative fatigue. The signal to watch is click through rate or detail page view rate declining while frequency stays flat or rises, which points to the creative itself rather than the audience or bid.
Detail Page View Rate = (Detail Page Views ÷ Impressions) × 100
A practical refresh cadence is monthly for prospecting creative, since that audience sees it less repeatedly, and closer to every three to four weeks for retargeting creative, since a smaller retargeting pool means the same users hit a given frequency threshold faster. Testing two creative variants against the same audience at the same time, rather than sequentially, removes seasonality and demand fluctuation as a confounding factor when comparing results.
EXAMPLE: A retargeting creative for a skincare brand holds a 0.45% detail page view rate through week 3, then drifts to 0.31% by week 6 even though weekly frequency is unchanged at roughly 4.2. Since the audience and frequency are both stable, the decline points to creative fatigue, the fix is a refresh, not a bid or targeting change.
6. Exclusion Lists and Negative Targeting
Exclusion targeting is the optimization lever with the least visibility because it does not show up as a metric improving, it shows up as wasted spend never happening in the first place. Two exclusion practices matter most: excluding recent purchasers from new to brand prospecting audiences so acquisition budget is not spent reaching people who already bought, and excluding ASINs that have gone out of stock or lost the buy box from active retargeting, since that spend cannot convert regardless of how well targeted the audience is.
EXAMPLE: A bestselling ASIN goes out of stock for six days during a demand spike. Without an inventory-linked exclusion rule, the brand's retargeting campaign keeps serving impressions against that ASIN the entire time, spend with zero possible conversion. An automated exclusion tied to live inventory status would have paused that specific ASIN the moment stock hit zero, redirecting the budget to in-stock SKUs instead.
7. Attribution Window and Measurement Optimization
An optimization decision is only as good as the attribution window it is measured against. Amazon DSP runs a 14 day click and 1 day view through attribution window by default, as detailed in Amazon's own DSP guide, which fits an impulse purchase category reasonably well but systematically undercounts contribution in a category with a longer consideration cycle, electronics, appliances, and higher priced categories among them.
Reviewing whether the default window still matches the actual purchase cycle for the product being advertised is a measurement optimization, not a targeting one, and it changes how every other lever in this guide gets judged. A campaign that looks like it needs an audience or bid fix might actually need a longer attribution window applied before any other change is made.
Unified reporting across Sponsored Ads and DSP, which reached general availability in June 2026, makes this cross check easier than it used to be, since overlap between the two channels can now be reviewed in a single report rather than reconciling two separate exports by hand.
EXAMPLE: An appliance brand's DSP dashboard shows attributed revenue down 18% year over year for the same media plan and flat sell-through. Rather than concluding the campaign underperformed, pulling Purchases (All Views) shows revenue essentially flat versus 2025, the gap was the January 2026 DSP attribution model change filtering out view-through credit that likely wasn't influencing purchases anyway, not a real decline in sales.
8. Dayparting and Delivery Pacing
Delivery that is technically on pace for the month can still be inefficient within the week if it is not spread against when the target audience is actually active. Reviewing hourly and day of week delivery data against conversion timing, available in Amazon DSP reporting, and adjusting bid multipliers or budget caps by day part is a lower-effort optimisation than most advertisers realize, and it tends to be the lever most overlooked because it requires no audience or creative work at all, only a pacing adjustment.
A dayparting framework includes reviewing hourly and day-of-week delivery, identifying periods with stronger conversion rates, and then shifting bid or budget weighting toward those windows. Recheck performance regularly and adjust as conversion patterns change.
EXAMPLE: A pet supplies brand finds that 60% of its DSP-attributed conversions land between 7 PM and 11 PM local time, but delivery is spread evenly across all 24 hours. Shifting budget weighting toward that window, without changing the total daily spend, lifts conversion rate without requiring a single audience or creative change.
9. Supply Source and Viewability Optimization
Amazon's DSP buys impressions across Amazon owned inventory as well as third party exchanges and publishers, and the two do not perform the same. A supply source with weak viewability, meaning the ad technically loaded but was never actually seen, or with return on ad spend and detail page view rate meaningfully below the account average, is a candidate for exclusion regardless of how well the audience or creative on that line item is performing.
Reviewing supply source performance on a recurring cadence, not just at campaign launch, catches drift that a one time setup check misses, since a publisher that performed well in month one can quietly deteriorate as its traffic mix changes. Excluding underperforming domains and apps from the supply source list, and setting a minimum viewability rate rather than accepting every available placement, keeps spend concentrated on inventory that can actually convert.
EXAMPLE: A home goods brand's prospecting campaign shows a healthy blended ROAS overall, but a supply source breakdown shows one mobile app publisher accounts for 22% of impressions at a viewability rate under 40%, against 78% across the rest of the campaign. Excluding that single source, without changing budget, bid, or audience, lifts the campaign's overall detail page view rate by double digits within a week.
10. Avoid Over-Optimizing: Give the Campaign Room to Learn
Every lever above is easy to over apply. Amazon's DSP algorithm needs a stable input to learn from, and a bid, budget, or audience change made every day in response to a single day's numbers resets that learning cycle before it has a chance to complete, which is a common way an account ends up chasing its own noise rather than improving.
A practical rule is to hold a change for at least one full attribution cycle before deciding whether it worked, and to avoid touching more than one lever on a line item within that window so the result can actually be attributed to the change that caused it. Upper funnel prospecting in particular needs a longer runway than a retargeting line item, since the consideration and purchase cycle it is feeding is longer than the campaign's own reporting window suggests.
EXAMPLE: A supplement brand's account manager adjusts a prospecting line item's CPM three times in one week, chasing daily ROAS swings. Each change resets the campaign's delivery pattern before the algorithm can settle on it, and by week's end the line item has less reach than it started with despite three attempts to improve it. Leaving the same bid untouched for a full attribution cycle the following month, delivery stabilizes and ROAS lands within target without a single further change.
How Atom11 Helps Optimize Amazon DSP Campaigns
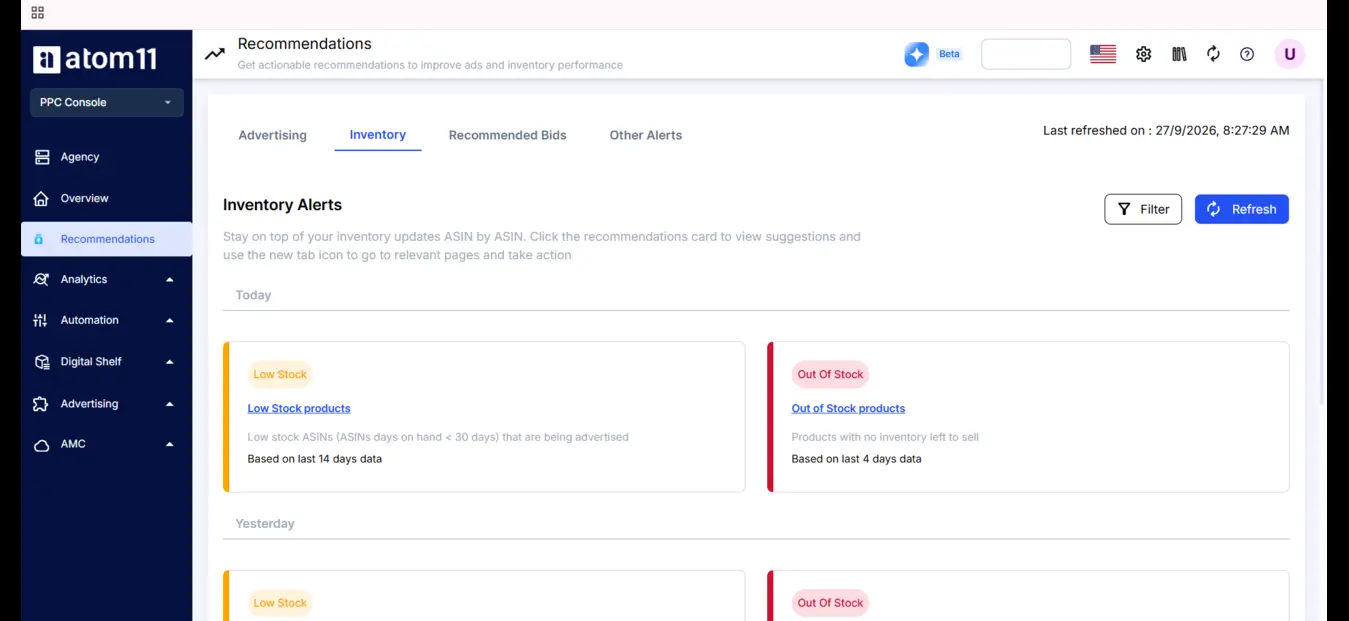
Every lever above can be run manually, but several of them depend on cross-referencing data that DSP reporting alone does not surface: inventory status, Buy Box position, and organic rank, which is where retail-aware optimisation tooling changes the actual effort involved.
Retail-aware bid logic for CPM and exclusion decisions. Atom11 ties bid and budget decisions to live inventory position, Buy Box status, and pricing, so the exclusion practice covered above, pulling an out-of-stock or Buy Box-losing ASIN out of active retargeting, happens automatically rather than requiring a manual inventory check against every active line item.
Neo for diagnosing which lever actually moved. When a metric crosses a variance threshold, Neo compares ad and retail signals across the relevant period to surface a likely cause, which shortens the diagnostic step of deciding whether a creative, audience, inventory, or bid issue is behind a given drop before choosing which lever above to adjust.
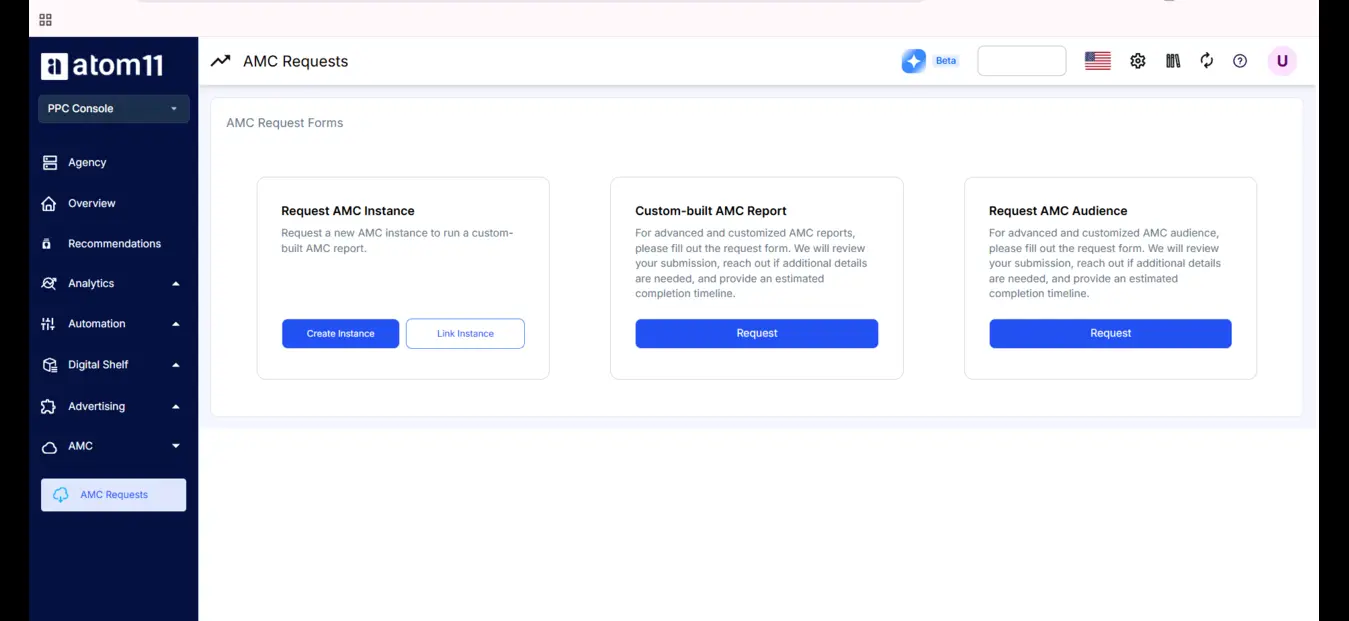
AMC audience building without a data analyst. The audience refinement sequence covered above, excluding recent purchasers or narrowing to a more precise segment, traditionally requires SQL access to Amazon Marketing Cloud. Atom11's drag and drop AMC builder makes that refinement accessible without a dedicated analyst on staff.
Version control for safer testing. Every bid and budget state can be saved before a change is made, so testing a new CPM ceiling or audience configuration against the recommendations above can be rolled back cleanly if the result is worse rather than reconstructed from memory.
Atom11 for DSP specifically
For teams running the levers above in-house, Atom11's DSP software starts at $499/month for accounts under $50K in monthly ad spend, or 2% of spend above that threshold, with Neo and Claude/MCP integration included at every tier, not gated behind an add-on. For teams that would rather have the strategy and implementation run by specialists, Atom11's DSP Managed Service adds strategy, an analytics dashboard, implementation, and reporting on top of the software. Since Atom11's pricing structure is updated periodically, confirm current tiers with the team directly.
Conclusion
Optimizing an Amazon DSP campaign works best as a sequence, not a single pass. Start with what Amazon's own recommendations engine is already suggesting before touching anything manually, then move through frequency, bid, audience, creative, exclusion, attribution, and pacing in roughly that order as the campaign accumulates enough data to make each lever meaningful. The accounts that improve fastest are not the ones adjusting the most settings, they are the ones checking the recommendations that already exist before layering manual changes on top, and revisiting each lever on a cadence rather than only when a metric visibly drops.
Atom11 is a retail-aware Amazon PPC and DSP platform built by ex-Amazonians, rated 4.8/5 on G2, a 3x Amazon Ads Partner Award winner, and trusted by 1,000+ brands and agencies.
Book a demo to see retail-aware bid logic, Neo, and dayparting run against your own DSP account.
FAQs
Where do I find Amazon's own DSP optimization recommendations?
Inside the DSP console, a guidance panel surfaces pre flight recommendations for maximum average CPM and frequency caps before a campaign launches, and continues to update with in flight suggestions once the campaign is live. Advertisers with programmatic access can also pull the same recommendations through the DSP Guidance API.
What is the first thing I should optimize in a new Amazon DSP campaign?
Check Amazon's pre flight recommendations before making any manual change, since they are built from the platform's own delivery data for that specific campaign goal and locale, which makes them a more informed starting point than a generic bid or frequency benchmark.
How do I know if my Amazon DSP audience is saturated?
Compare week over week frequency growth against week over week reach growth for the line item. If frequency is rising faster than reach, the audience pool is saturated and additional budget will raise cost without adding meaningful new reach.
How often should Amazon DSP creative be refreshed?
A practical cadence is monthly for prospecting creative and every three to four weeks for retargeting creative, since a smaller retargeting audience pool reaches a given frequency threshold faster and shows fatigue sooner.
Does the default attribution window affect how I should optimize a campaign?
Yes. Amazon DSP's default 14 day click and 1 day view through window can undercount contribution in categories with longer consideration cycles, which means an audience or bid change that looks necessary might actually be a measurement window problem.
